

Question: For this project, you will write an event-driven program using a Graphical User Interface (GUI) called FunctionPlotter. 1. (10 Points if these are all present)
For this project, you will write an event-driven program using a Graphical User Interface (GUI) called FunctionPlotter.
1. (10 Points if these are all present) Open GUIDE and add the following user interface controls (i.e., widgets, GUI objects) 1.1.textFunc: "f =" 1.2.editFunc: The box where the user will type an anonymous function definition 1.3.textXMin: "xMin" 1.4.textXMax: "xMax" 1.5.editXMin: The box where the user will type the minimum x value 1.6.editXMax: The box where the user will type the maximum x value 1.7.pushbuttonPlot: The pushbutton which will cause the anonymous function to plot 1.8.pushbuttonGrid: A pushbutton which cycles the background grid on and off 1.9.pushbuttonLegend: A pushbutton which cycles the plot legend on and off 1.10. pushbuttonHold: A pushbutton which cycles the plot hold state on and off 1.11. textHold: "Hold On" or "Hold Off" 1.12. axesPlot: The area where the plot will appear
2. (5 Points if these are present) Modify the FunctionPlotter_OpeningFcn. Before guidata(hObject, handles), add the following fields to the handles structure and initialize them to false; 2.1. holdOn: this will be used to keep track whether the plot hold is on (true) or off (false) 2.2. gridOn: this will be used to keep track of whether the grid is on (true) or off (false) 2.3. legendOn: this will be used to keep track of whether the legend is displayed (true) or not (false)
3. (5 Points if this callback works) Write the callback function for pushbuttonGrid_Callback 3.1.If the grid is currently displayed, turn it off as follows 3.1.1. Update the gridOn field of the handles structure to be false 3.1.2. axes(handles.axesPlot); % This makes the axesPlot widget the current axes. 3.1.3. grid off; 3.2.Otherwise the grid is not on and we want to turn it on as follows: 3.2.1. Update the gridOn field of the handles structure to be true 3.2.2. axes(handles.axesPlot); 3.2.3. grid on; 3.3.Finally, ensure all user interface controls get the updated handles structure with 3.3.1. guidata(hObject, handles);
4. (5 Points if this callback works) Write the callback function for pushbuttonHold_Callback 4.1.If hold is currently on, turn it off as follows 4.1.1. Update the holdOn field of the handles structure to be false 4.1.2. Update the string field of textHold to say "Hold Off" 4.1.3. axes(handles.axesPlot); % This makes the axesPlot widget the current axes. 4.1.4. cla; % This command clears the plot ("Clear Axes") 4.1.5. hold off; 4.2.Otherwise plot hold must be off, so turn it on as follows: 4.2.1. Update the holdOn field of the handles structure to be true 4.2.2. axes(handles.axesPlot); 4.2.3. Update the string field of textHold to say "Hold On" 4.2.4. hold on; 4.3.Finally, ensure all user interface controls get the updated handles structure with 4.3.1. guidata(hObject, handles);
5. (5 Points if this callback works) Write the callback function for pushbuttonLegend_Callback 5.1. Turn the legend on by default and get the handle to it (the legend may be made invisible a few lines from now depending on the state of handles.legendOn, but for now we are turning it on) as follows: 5.1.1. hLeg = legend; 5.2. If the legend state is currently on, we want to turn it off as follows 5.2.1. Update the legendOn field of the handles structure to be false 5.2.2. axes(handles.axesPlot); 5.2.3. set(hLeg, 'visible', 'off'); 5.3.Otherwise the legend state is currently off and we want to turn it on as follows: 5.3.1. Update the legendOn field of the handles structure to be true 5.3.2. axes(handles.axesPlot); 5.3.3. set(hLeg, 'visible', 'on'); 5.4.Finally, ensure all user interface controls get the updated handles structure with 5.4.1.guidata(hObject, handles);
6. (20 Points if this callback works) Finally, complete the pushbuttonPlot_Callback 6.1. Get the current string property of editFunc and assign it to variable funcStr. 6.2. Get the current string property of editXMin and assign it to variable xMin. 6.3. Get the current string property of editXMax and assign it to variable xMax. 6.4. Assign variable x to be [xMin, xMax]. You'll have to convert xMin and xMax from strings to numbers. 6.5. Use eval to evaluate funcStr and assign the result to variable func. This important step turns the string typed by the user into a function handle. Do this as follows 6.5.1. Use iscell to determine if funcStr is a cell. (The string typed by the user may be stored as a (1,1) cell array.) 6.5.1.1. If it is a cell: func = eval(funcStr{1}); 6.5.1.2. If it isn't a cell: func = eval(funcStr); 6.6. Use a "try/catch" block as follows:
try func(x(1)); % Set the string field of the textError widget to "OK". axes(handles.axesPlot); % Use fplot to evaluate func over x catch % Set the string field of the textError widget to % "Invalid function". end The above code block tests the string that the user entered by trying to evaluate the function at xMin. If the function is not valid, or if the user hasn't specified xMin, then func(x(1)) will produce an error which will trigger the code block after catch to run.
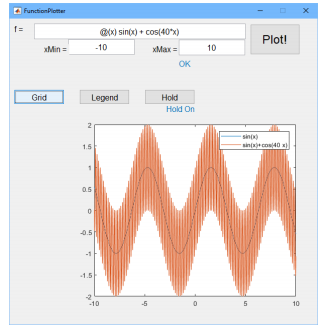
@lx) sin(x) + COs(40.x) Max10 OK Min: 10 ?? GndLMon Legend Hold Hold On sin 1.5 0.5 1.5 -2 @lx) sin(x) + COs(40.x) Max10 OK Min: 10 ?? GndLMon Legend Hold Hold On sin 1.5 0.5 1.5 -2
Step by Step Solution
There are 3 Steps involved in it

Get step-by-step solutions from verified subject matter experts