

Question: For this question, could you help me to make a total amount om distance. (3).Is there a multiple linear regression relationship between the total amount

For this question, could you help me to make a

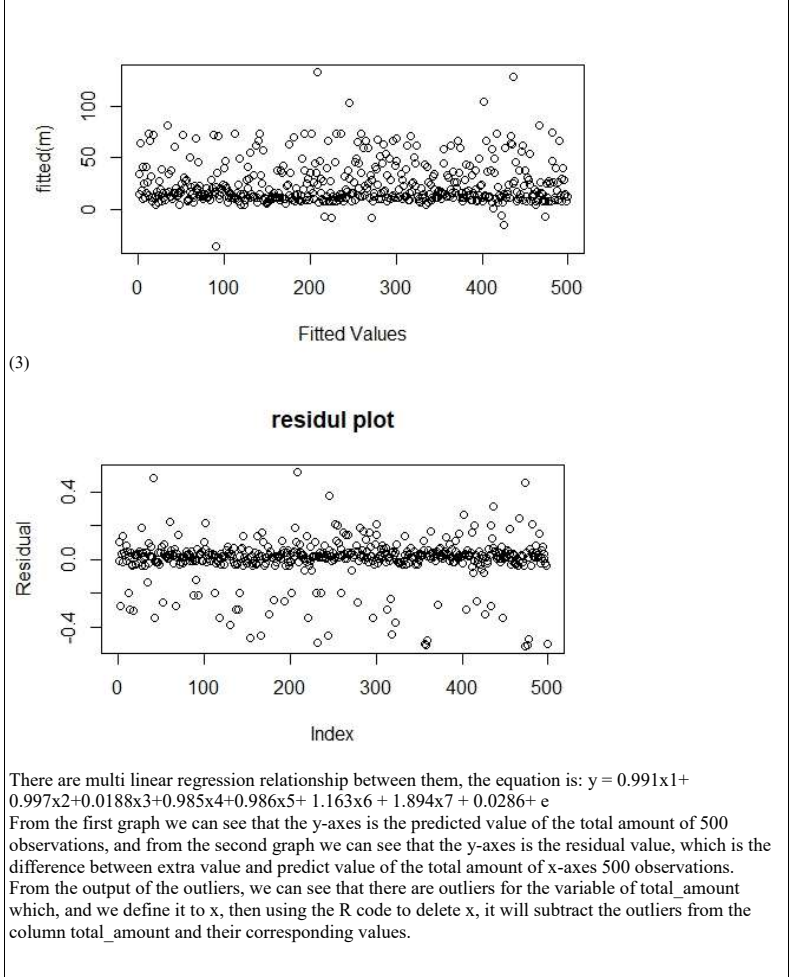
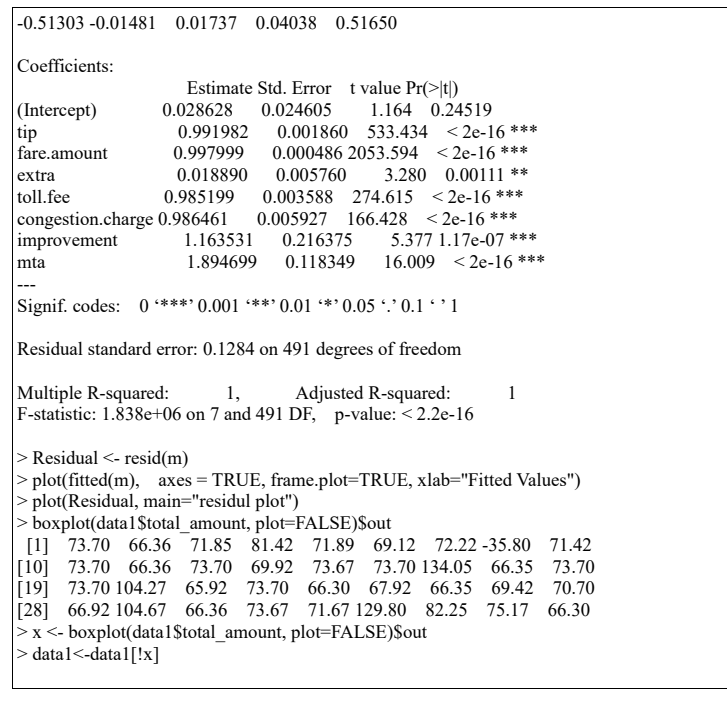
total amount om distance. (3).Is there a multiple linear regression relationship between the total amount and several types of payment amounts? Make a tted value, are there any outliers? Please remove the outliers and make a histogram for the residual outliers. -0.51303 -0.01481 0.01737 0.04038 0.51650 Coefficients: Estimate Std. Error t value Pr(>It)) (Intercept) 0.028628 0.024605 1.164 0.24519 tip 0.991982 0.001860 533.434 Residual plot(fitted(m), axes = TRUE, frame.plot=TRUE, xlab="Fitted Values") > plot(Residual, main="residul plot") > boxplot(datal Stotal_amount, plot=FALSE)Sout [1] 73.70 66.36 71.85 81.42 71.89 69.12 72.22 -35.80 71.42 [10] 73.70 66.36 73.70 69.92 73.67 73.70 134.05 66.35 73.70 19] 73.70 104.27 65.92 73.70 66.30 67.92 66.35 69.42 70.70 [28] 66.92 104.67 66.36 73.67 71.67 129.80 82.25 75.17 66.30 > x datal
Step by Step Solution
There are 3 Steps involved in it

Get step-by-step solutions from verified subject matter experts