

Question: A firm recorded its sales (Qt) in monthly observations from January 2013 to August 2014. The data collected is shown in the table below: Sales
A firm recorded its sales (Qt) in monthly observations from January 2013 to August 2014. The data collected is shown in the table below:
Sales ($ Thousands)
Qt | |
Jan-13 | 46 |
Feb-13 | 56 |
Mar-13 | 72 |
May-13 | 67 |
Jun-13 | 77 |
Aug-13 | 66 |
Sep-13 | 69 |
Oct-13 | 79 |
Dec-13 | 88 |
Jan-14 | 91 |
Mar-14 | 94 |
Apr-14 | 104 |
Jun-14 | 100 |
Jul-14 | 113 |
Aug-14 | 120 |
a. Below is the output:
| Regression Statistics | |
| Multiple R | 0.960795768 |
| R Square | 0.923128508 |
| Adjusted R Square | 0.917215316 |
| Standard Error | 6.064850994 |
| Observations | 15 |
| ANOVA | |||||
| df | SS | MS | F | Significance F | |
| Regression | 1 | 5742.228571 | 5742.228571 | 156.1134082 | 1.28554E-08 |
| Residual | 13 | 478.1714286 | 36.78241758 | ||
| Total | 14 | 6220.4 |
| Dependent var: Qt | Coefficients | Standard Error | t Stat | P-value |
| Intercept | 46.57 | 3.30 | 14.13 | 2.87E-09 |
| t | 4.53 | 0.36 | 12.49 | 1.29E-08 |
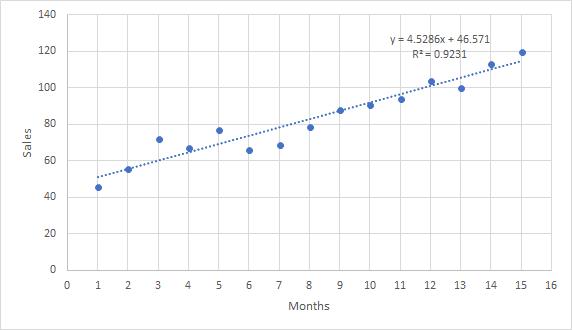
b. The intercept (a) is 46.57. It tells us the value of Sales that is not dependent on time.
c. The slope term (b) is 4.53. It tells us the change in Sales when the time increases by 1 month.
d.
|
e. Forecast the level of sales in August 2015. Show your result in the chart.
f. Forecast the level of sales for August 2018. Don’t need to show it in the chart.
g. Which forecast is more reliable, 2015 or 2018? Why? Explain.
140 y= 4.5286x + 46.571 120 R= 0.9231 100 80 60 40 20 3 4 6. 7 10 11 12 13 14 15 16 Months Sales
Step by Step Solution
3.45 Rating (168 Votes )
There are 3 Steps involved in it
aExcel Data Data Analysis Regression Select the appro... View full answer

Get step-by-step solutions from verified subject matter experts
Document Format (2 attachments)
635dc2b5b27cc_178637.pdf
180 KBs PDF File
635dc2b5b27cc_178637.docx
120 KBs Word File