

Question: ) For this question, refer to the Excel file named Data for HW1. A manufacturing company produces drill bits and has to control the thickness
-
 ) For this question, refer to the Excel file named Data for HW1.
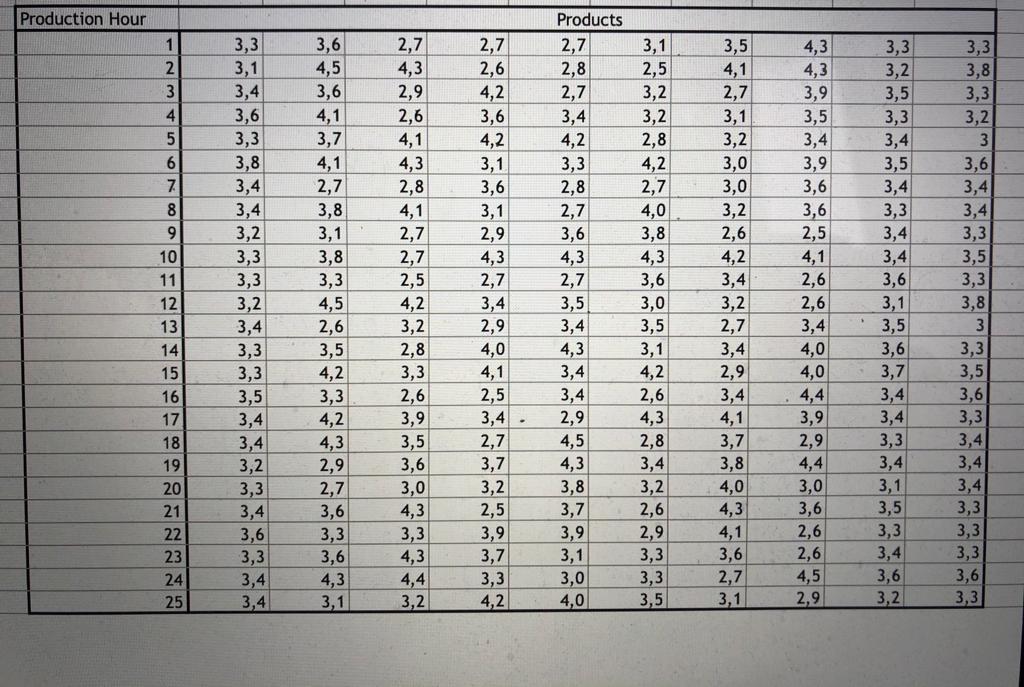
A manufacturing company produces drill bits and has to control the thickness of the tips produced. In each production hour, a random sample of 4 units need to be selected.
Please first prepare samples of 4 out of the given 10 products produced in each hour. Then, based on your samples, answer the following questions.
- Find the subgroup averages and subgroup ranges. Then, compute the average of averages, , and average range, .
- According to your findings in (a), plot an chart and an R chart.
- Find the central line and control limits for both charts (Hint: Use Table B on the last page). Which observations are outliers? (Calculate the UCL and LCL up to two decimal places).
- Suppose it was possible to find an assignable cause for all of the outliers in the chart and R chart. Then, what should be the revised central line and the control limits for the two charts?
- Suppose that the product specifications for the drill bits is 3.30.5. What can you say about the capability of the manufacturing process? (Hint: Estimate the process standard deviation by the formula: = /d2, where is the final average range value and d2 is to be found from Table B.)
Step by Step Solution
There are 3 Steps involved in it
1 Expert Approved Answer
Step: 1 Unlock

Question Has Been Solved by an Expert!
Get step-by-step solutions from verified subject matter experts
Step: 2 Unlock
Step: 3 Unlock