

Question: For this question use the following information: Data Display ROW IQ Score Mus.Apt. 95 30 106 37 110 35 104 28 98 17 114 45
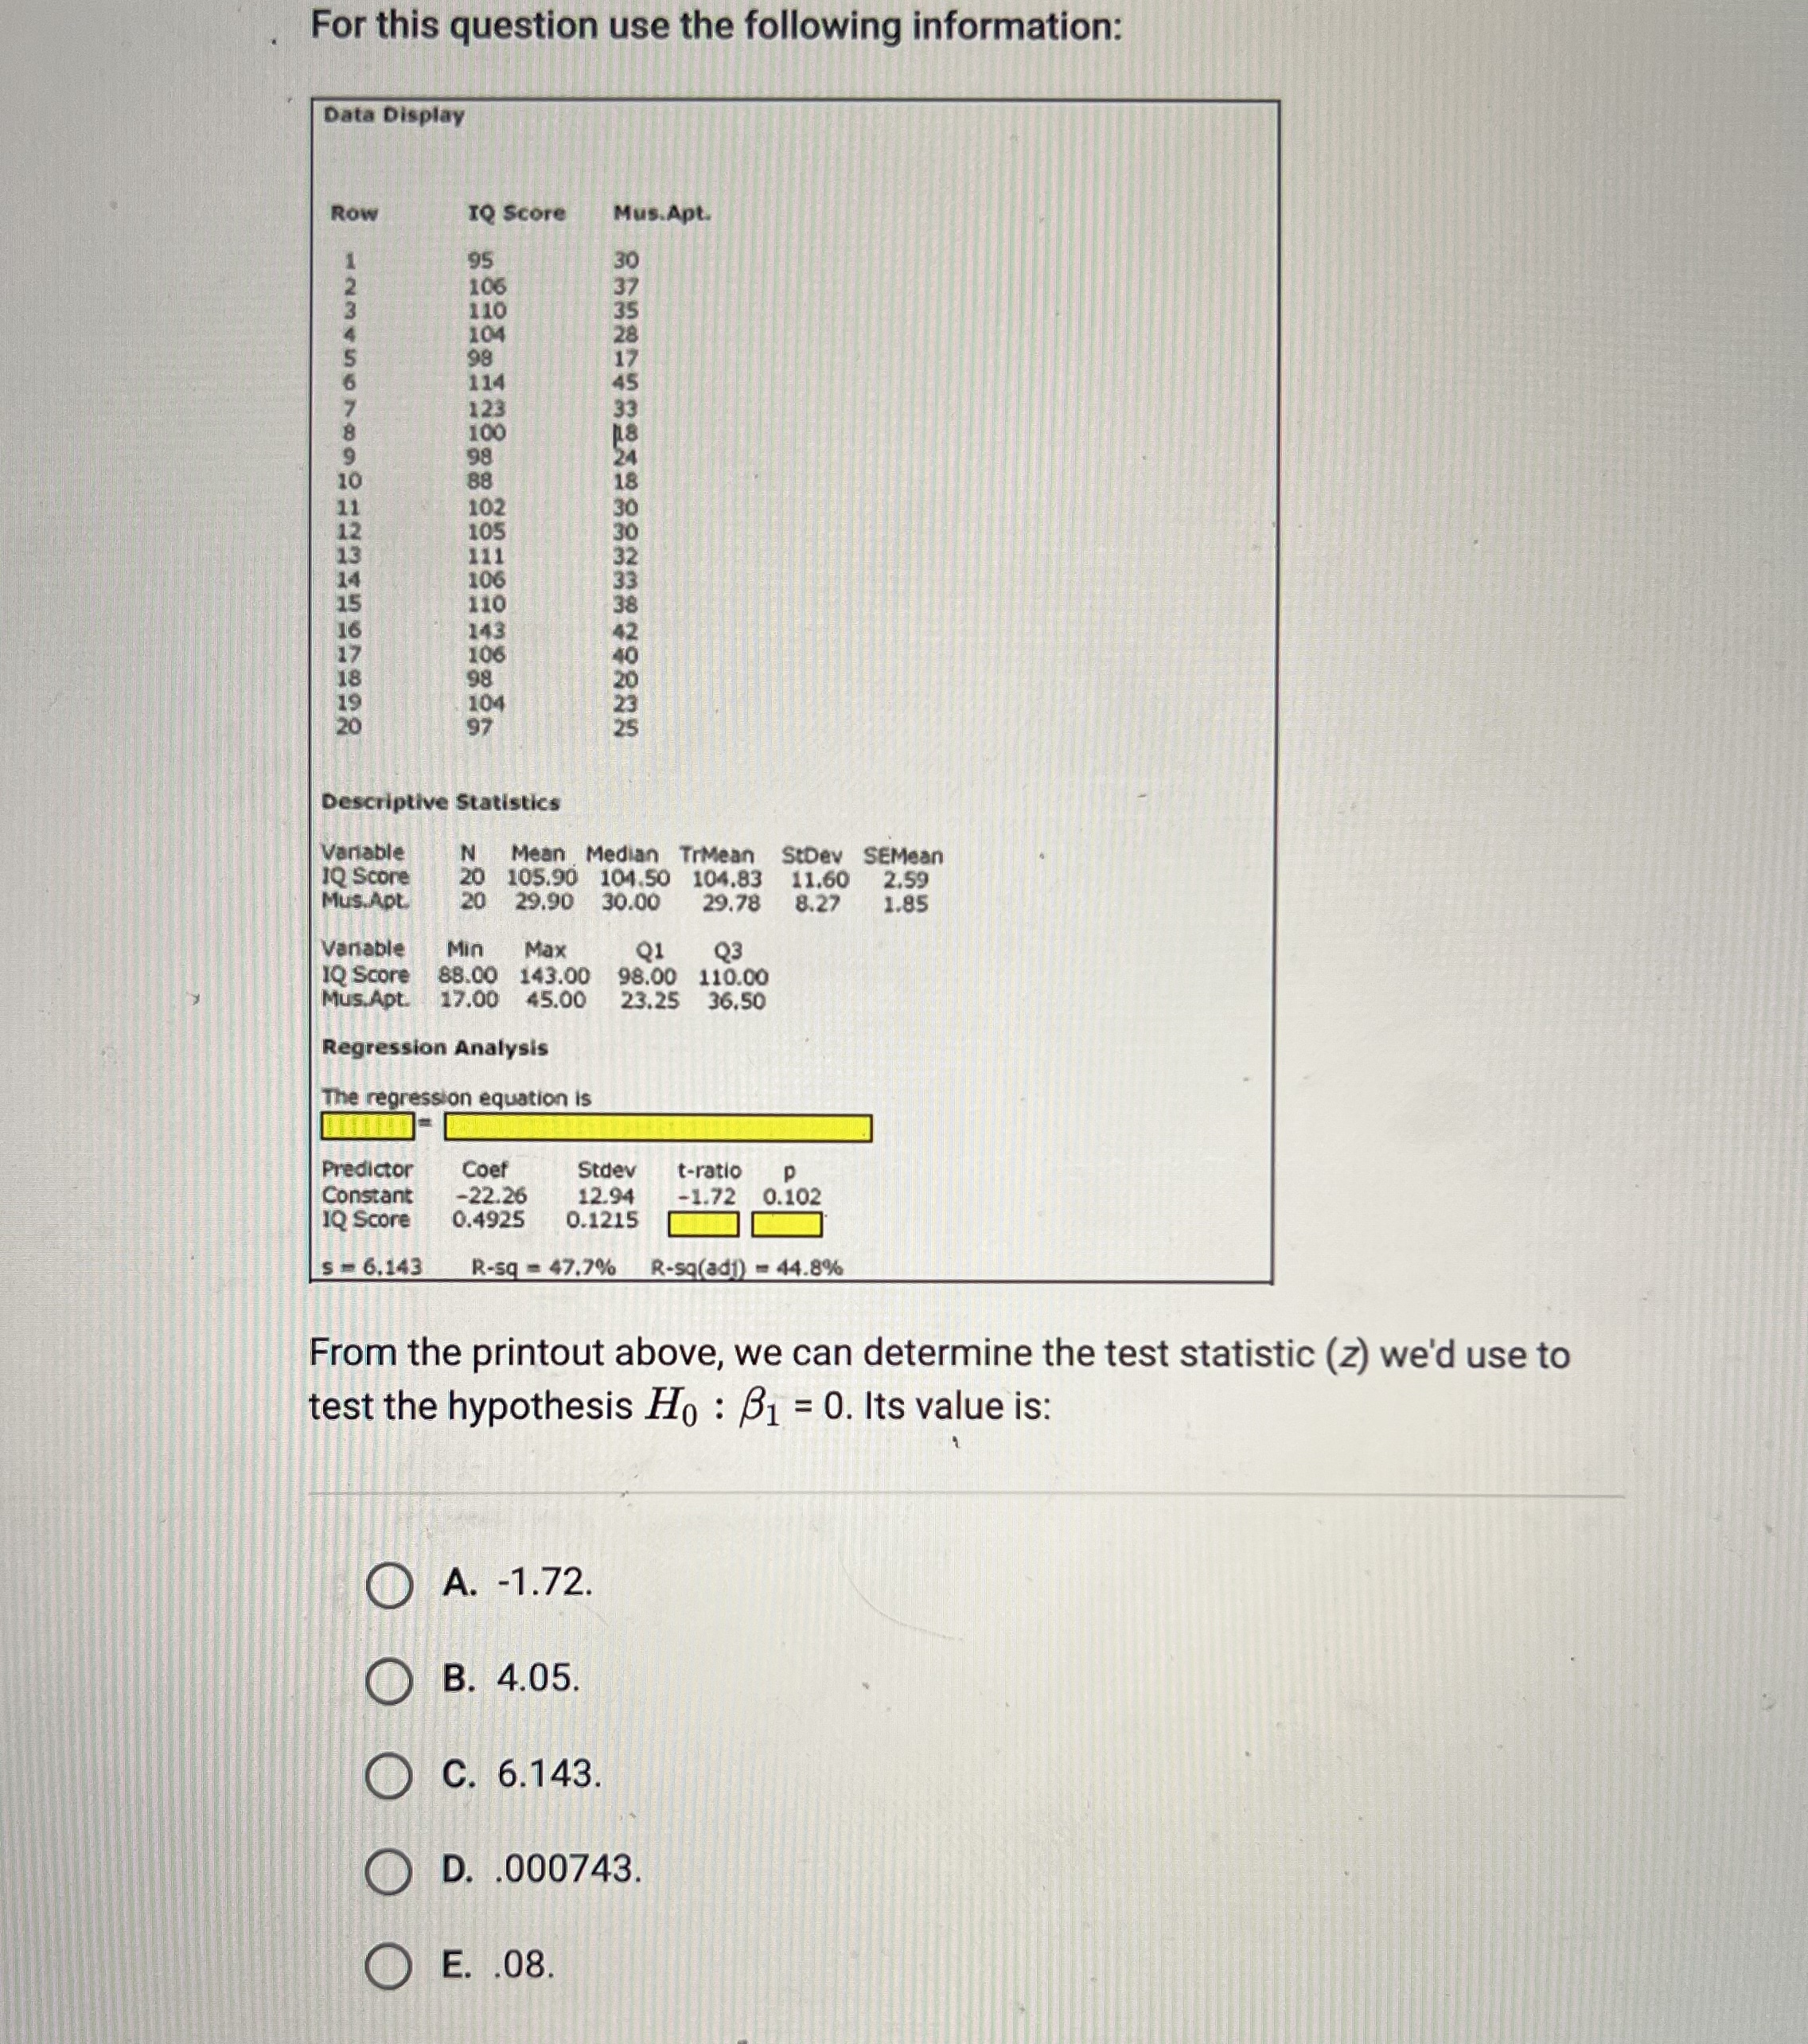
For this question use the following information: Data Display ROW IQ Score Mus.Apt. 95 30 106 37 110 35 104 28 98 17 114 45 123 33 100 98 102 105 106 143 106 98 104 23 Descriptive Statistics Variable N Mean Median TrMean StDev SEMean 10 Score 20 105.90 104.50 104.83 11.60 2.5 Mus.Apt. 20 29.90 30.00 29.78 8.27 1.85 Vanable Min Max Q1 1Q Score 88.00 143.00 98.00 110.00 Mus.Apt. 17.00 45.00 23.25 36.50 Regression Analysis The regression equation is Predictor Coef Stdev t-ratio Constant -22.26 12.94 -1.72 0.102 1Q Score 0.4925 0.1215 -6.143 R-sq = 47.7% R-sq(adj) = 44.8% From the printout above, we can determine the test statistic (z) we'd use to test the hypothesis Ho : B1 = 0. Its value is: A. - 1.72. O B. 4.05. O C. 6.143. OD. .000743. O E. .08
Step by Step Solution
There are 3 Steps involved in it

Get step-by-step solutions from verified subject matter experts