

Question: For this question, use the following multiple regression output (which may differ from the output in other questions, even though the variables are the same).
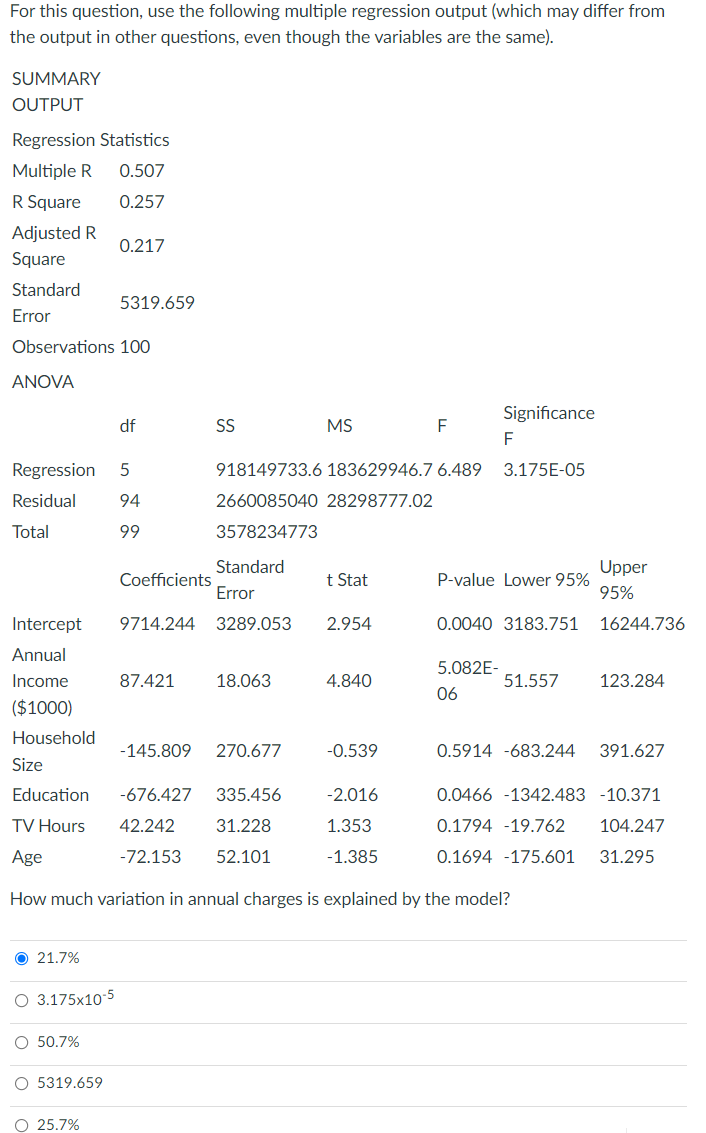
For this question, use the following multiple regression output (which may differ from the output in other questions, even though the variables are the same). SUMMARY OUTPUT Regression Statistics Multiple R 0.507 R Square 0.257 Adjusted R 0.217 Square Standard 5319.659 Error Observations 100 ANOVA Significance df SS MS F F Regression 5 918149733.6 183629946.7 6.489 3.175E-05 Residual 94 2660085040 28298777.02 Total 99 3578234773 Standard Coefficients Upper t Stat P-value Lower 95% Error 95% Intercept 9714.244 3289.053 2.954 0.0040 3183.751 16244.736 Annual 5.082E- Income 87.421 18.063 4.840 51.557 123.284 06 ($1000) Household -145.809 270.677 -0.539 0.5914 -683.244 391.627 Size Education -676.427 335.456 2.016 0.0466 -1342.483 -10.371 TV Hours 42.242 31.228 1.353 0.1794 -19.762 104.247 Age -72.153 52.101 -1.385 0.1694 -175.601 31.295 How much variation in annual charges is explained by the model? O 21.7% O 3.175x10⁻⁵ O 50.7% O 5319.659 O 25.7%
Step by Step Solution
There are 3 Steps involved in it

Get step-by-step solutions from verified subject matter experts