

Question: For this question, use the text box provided below to type your answers, copy and paste the R code and R output there too. In
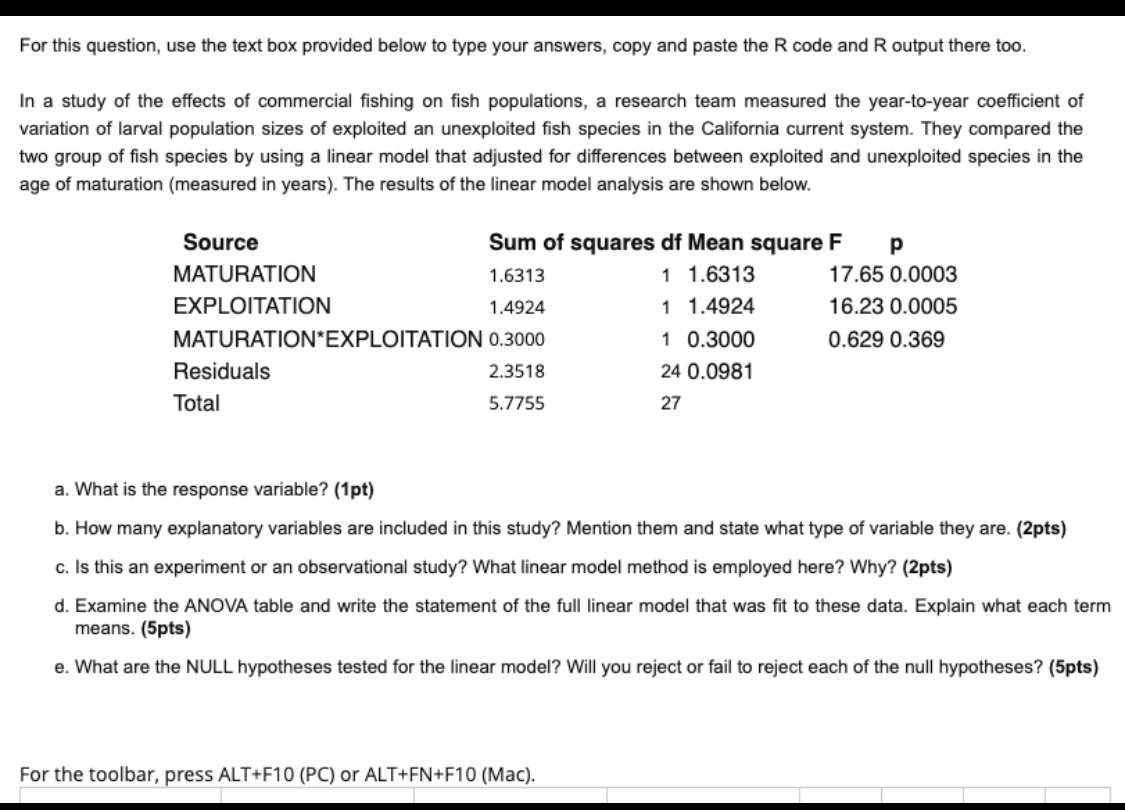
For this question, use the text box provided below to type your answers, copy and paste the R code and R output there too. In a study of the eects of commercial shing on sh populations, a research team measured the year-to-year coefficient of variation of larval population sizes of exploited an unexploited sh species in the California current system. They compared the two group of fish species by using a linear model that adjusted for differences between exploited and unexploited species in the age of maturation (measured in years). The results of the linear model analysis are shown below. Source Sum 01' squares 011' Mean square F p MATURATION 1.5313 1 1.6313 17.65 0.0003 EXPLOI'I'ATION 1.4924 1 1.4924 16.23 0.0005 MATURATION'EXPLOITATION 0.3000 1 0.3000 0.629 0.369 Residuals 2.3518 24 0.0961 Total 57755 27 a. What is the response variable? (1 pt} b. How many explanatory variables are included in this study? Mention them and state what type of variable they are. Rm) 0. Is this an experiment or an observational study? What linear model method is employed here? Why? (2900) :1. Examine the ANOVA table and write the statement of the full linear model that was t to these data. Explain what each term means. (Spa) e. What are the NULL hypotheses tested for the linear model? Will you reject or fail to reject each of the null hypotheses? (Slate) For the toolbar. press ALT+F10 (PC) or ALT+FN+F10 (Mac)
Step by Step Solution
There are 3 Steps involved in it

Get step-by-step solutions from verified subject matter experts