

Question: For this question, which two graphs would be suited to illustrate the content of the essay? Consider an economy where the level of production (Y)


For this question, which two graphs would be suited to illustrate the content of the essay?
Consider an economy where the level of production (Y) is not at the natural level (Yn), that is, an economy in which Y?Yn. Using the AS/AD model, explain what will happen next and suggest a monetary and/or a fiscal policy to adjust output and analyse the effect of this policy on price level and employment.
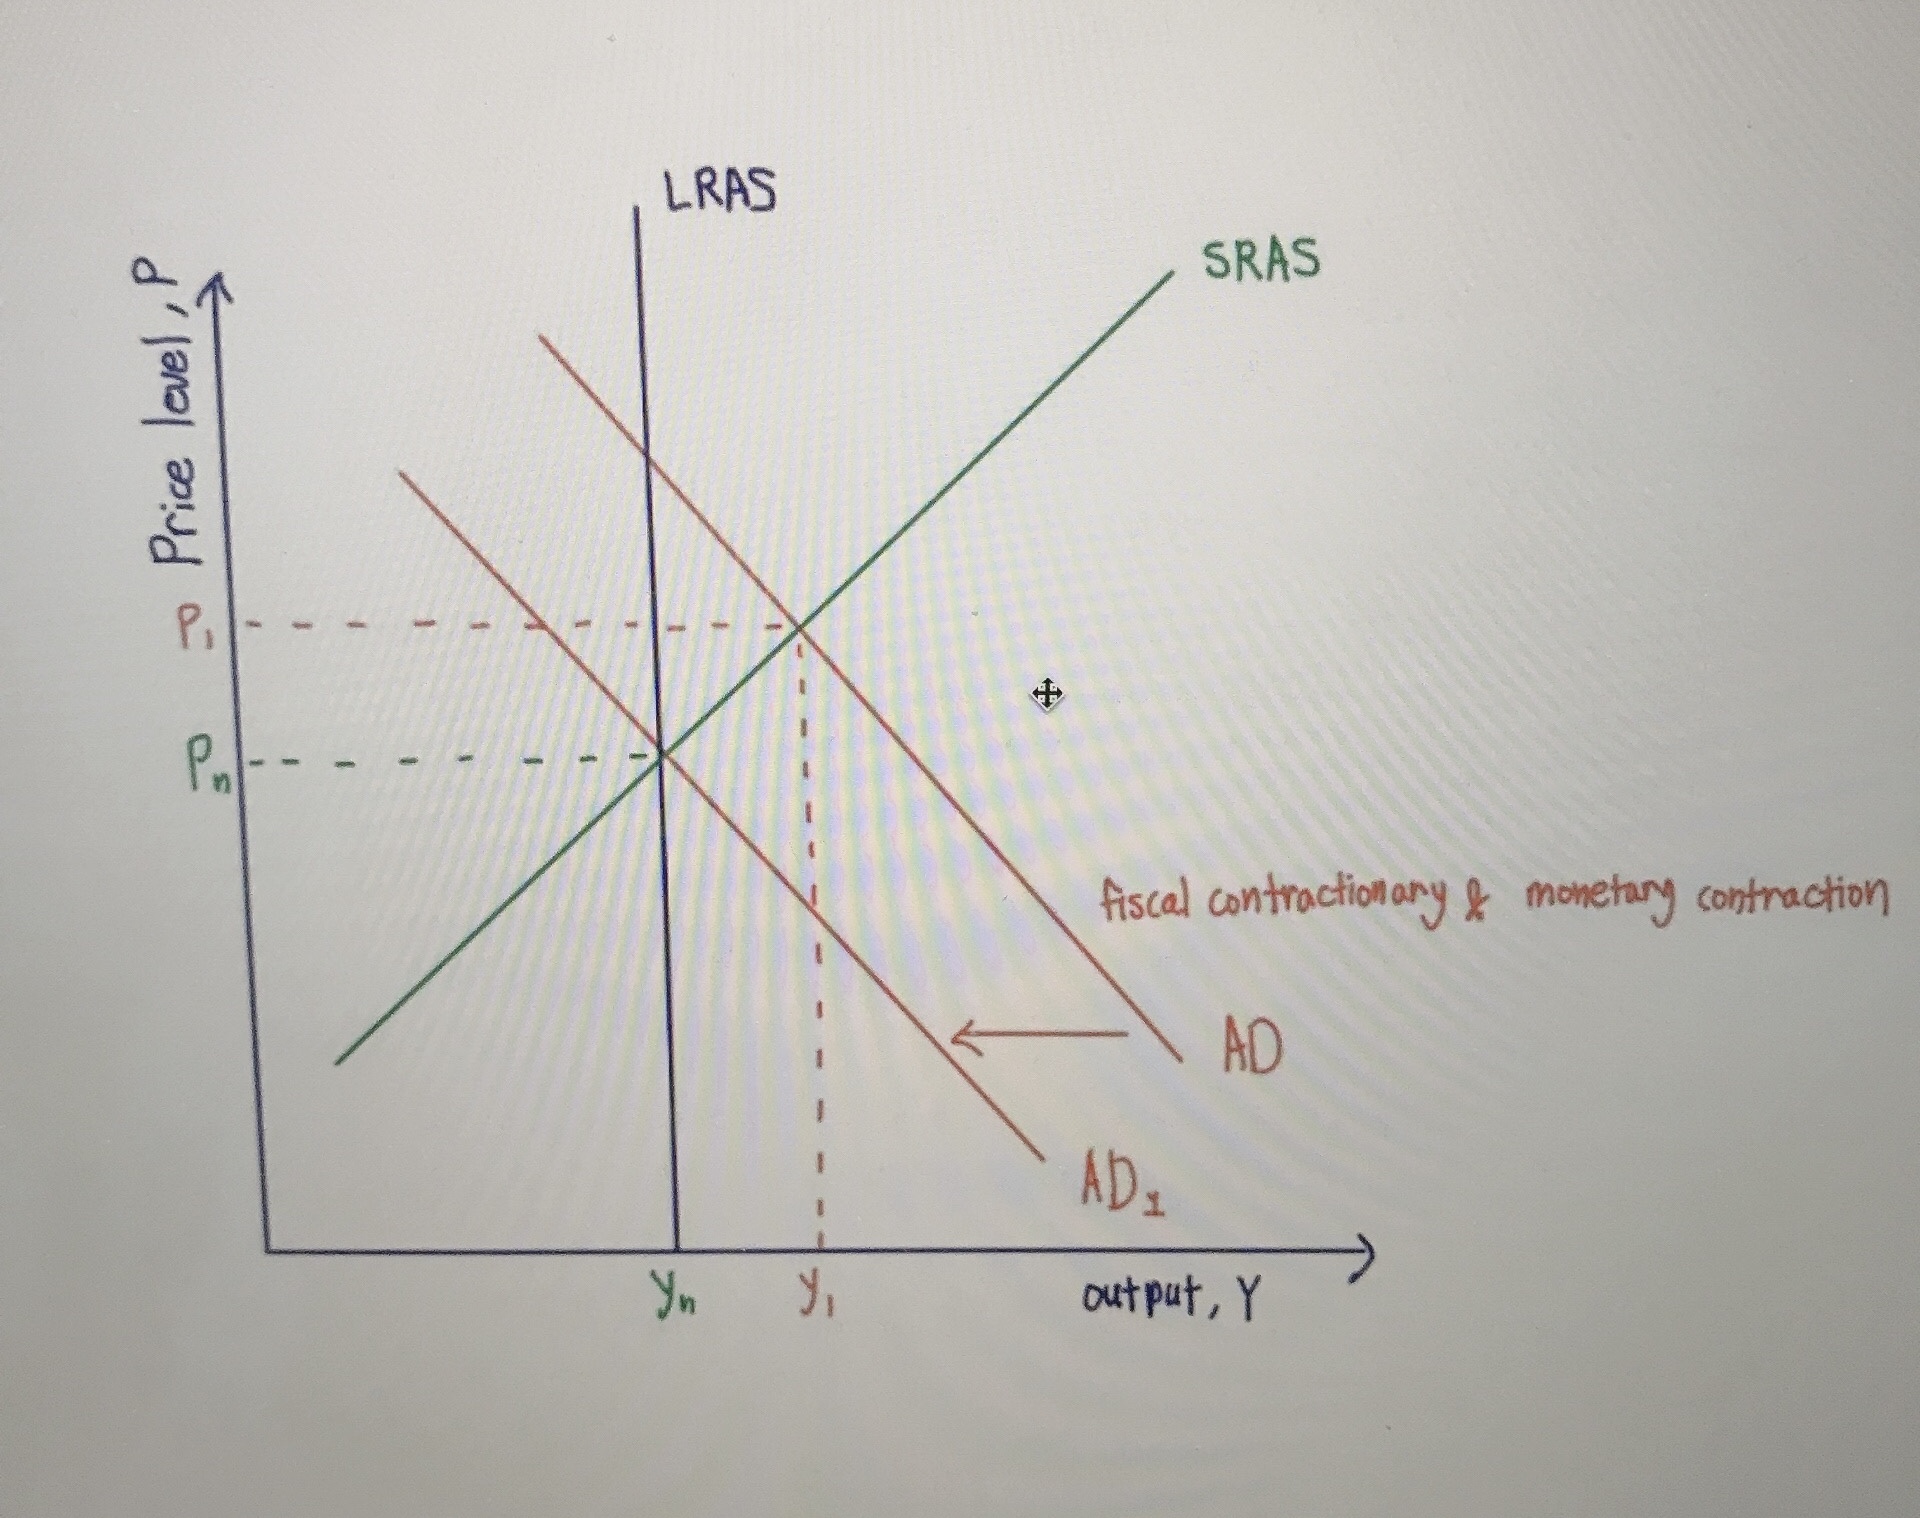
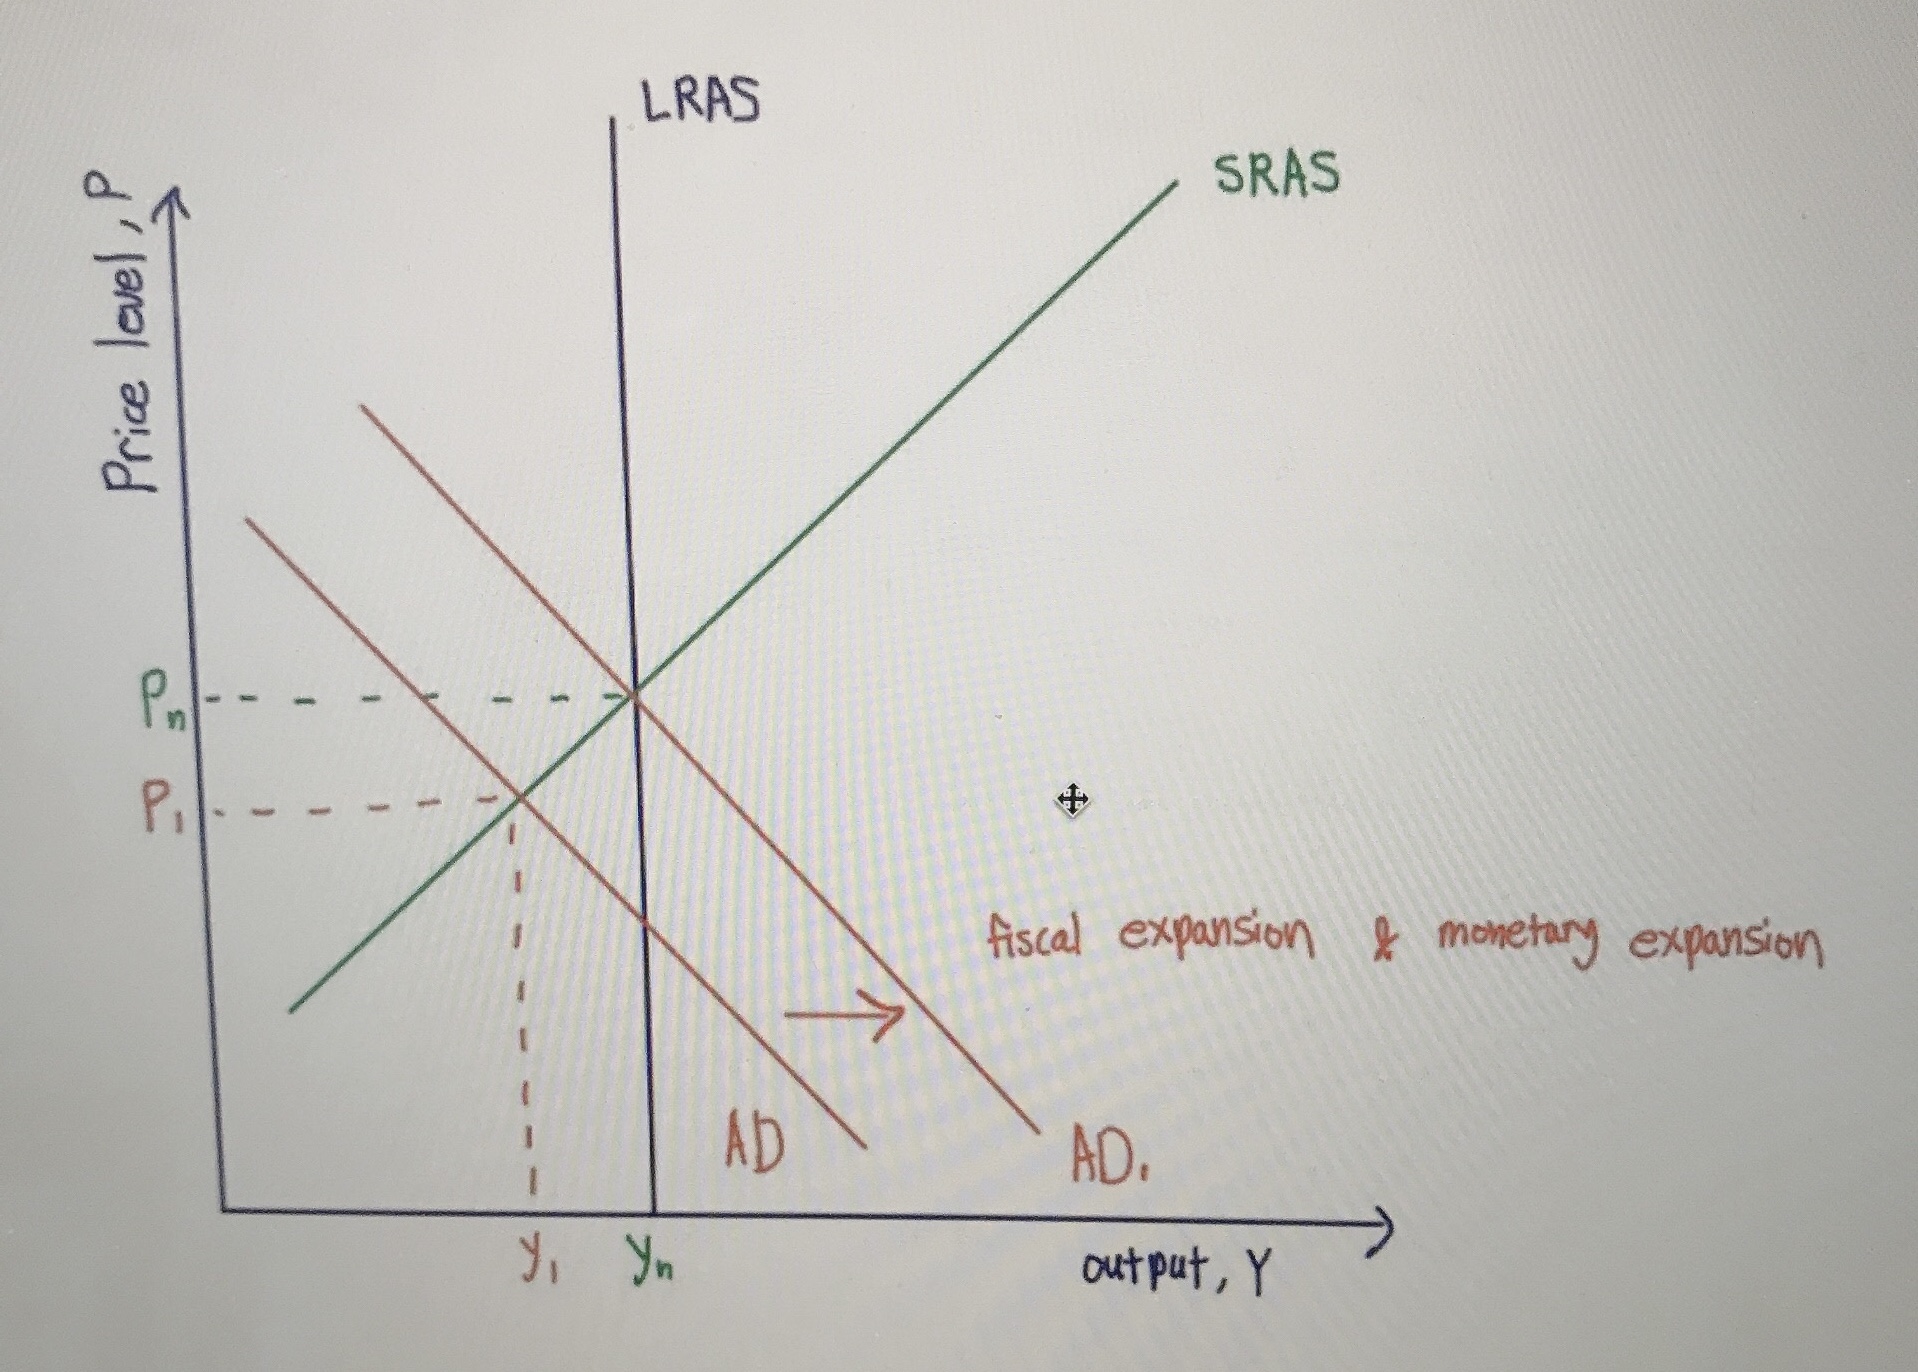
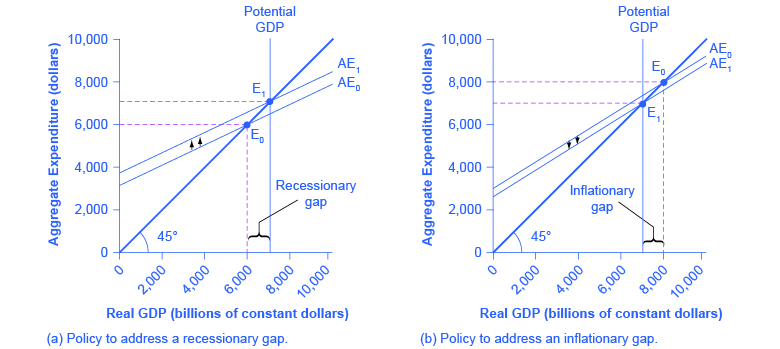
LRAS SRAS Price level , P - fiscal contractionany & monetary contraction AD AD output , YLRAS SRAS Price level , P Pal- - fiscal expansion & monetary expansion AD AD. y, yn output , YPotential Potential GDP 10,000 GDP 10,000 AE. AE ED AE, 8,000 AED 8,000 6,000 6,000 ED Aggregate Expenditure (dollars) Aggregate Expenditure (dollars) 4,000 4,000 Recessionary Inflationary 2,000 gap 2,000 gap 450 450 C 2,000 4,000 6,000 8,000 2,000 4,000 6,000 8,000 10, 10,000 Real GDP (billions of constant dollars) Real GDP (billions of constant dollars) (a) Policy to address a recessionary gap. (b) Policy to address an inflationary gap
Step by Step Solution
There are 3 Steps involved in it

Get step-by-step solutions from verified subject matter experts