

Question: For this question, you are asked to select a real Canadian company/stock on the TSX (include the ticker symbol) that is different from Q4 and
For this question, you are asked to select a real Canadian company/stock on the TSX (include the ticker symbol) that is different from Q4 and Q6 above. Students will then go to https://ca.finance.yahoo.com to create a basic technical/chart analysis of that company. Once the 2Prof.: Canadian Securities Chapter 13 Assignment 1 Group Number: N/A Group Members: N/A following steps are taken, students are asked to take a screen shot of their chart/analysis and insert the image into your assignment submission a) Go to https://ca.finance.yahoo.com. Although other websites may offer charting capabilities, please use this site for consistency purpose for this assignment b) In the Search bar at the top of the screen, find your company. Make sure that is a listed Canadian company on the TSX. Since TD is the example below, do not use TD for your submission. Copy the web address at this stage an include it in the assignment c) Once you've arrived on the page for your respective company, click "chart". You will find this underneath the pricing information and between the words "Summary" and "Conversions" d) Once you are on the chart click "5Y". If your company does not have a 5 year history, select the longest history that is available. Add the following to your chart: ? You will see one item above the chart called "line". Click this to convert your chart to a "Bar" chart. ? Use the "Draw" item to draw the long term support and resistance lines ? Add in two moving average (50 day and 200 day). Use different colours for each. ? Use the "Draw" item to identify any "long-term" Continuation or Reversal patterns. Only identify one or two of these items. ? Identify and comment on any points of interest or key observations that you find ? Take a screen shot/image/snip of your completed analysis and insert it into your completed assignment document. Example below:
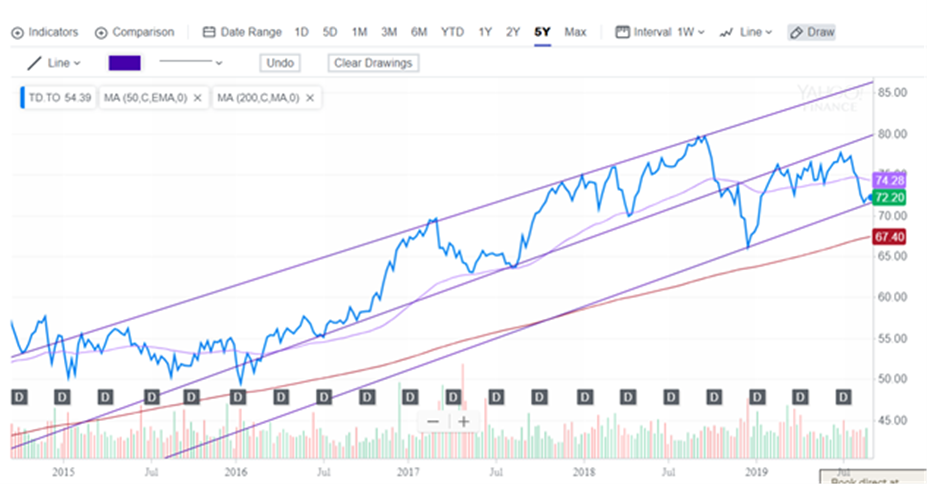
Indicators O Comparison = Date Range 1D 50 1M 3M 6M YTD 1Y 2Y 5Y Max Interval 1Ww ww Line Draw Line Undo Clear Drawings TO. TO 54 39 MA (50,C.EMA,0) X MA (200,C.MAO) X YAL 85.00 NANCE 80.00 74 28 72 20 70.00 67.40 65 00 60 00 V 55.00 50 00 D D D D D D D D D D D D D D D D D D D D + 45.00 2015 2016 2017 Jul 2018 Jul 2019
Step by Step Solution
There are 3 Steps involved in it

Get step-by-step solutions from verified subject matter experts