For this question, you will use JMP to analyze the Deflategate data set. This data set is based on the "Wells Report", outlining the finding from an investigation into whether there was strong evidence that the New England Patriots football team intentionally let air out of footballs during a playoff game in 2015. It is recommended that you read the .pdf document outlining what is in this data set before you begin. You can find this document on Canvas under "Additional Class Stuff / Data".
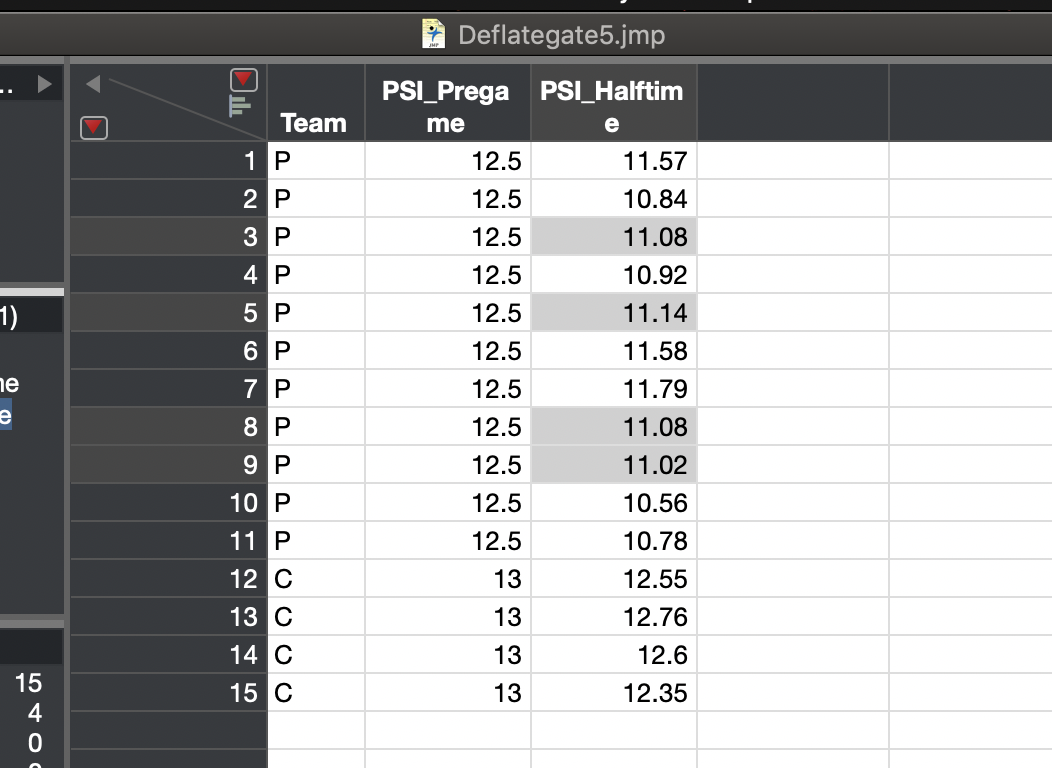
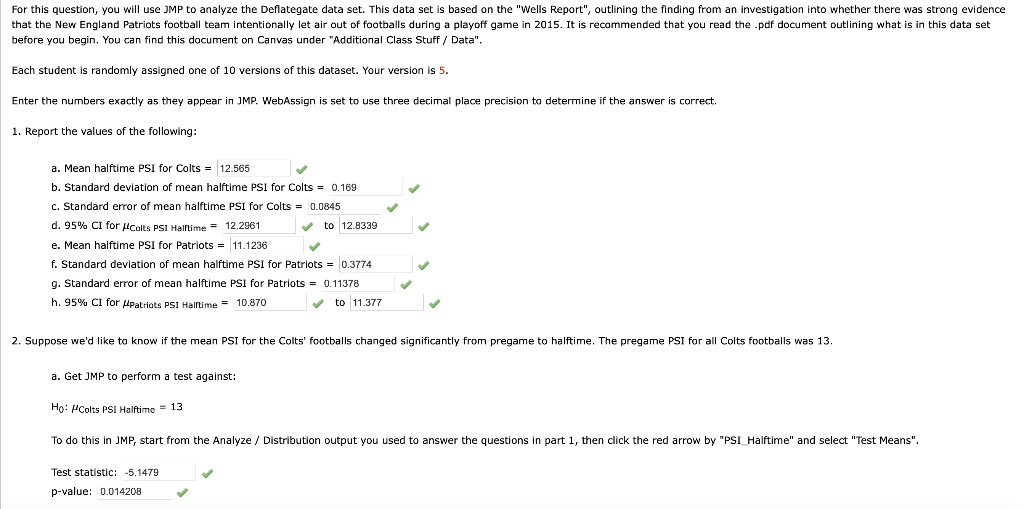
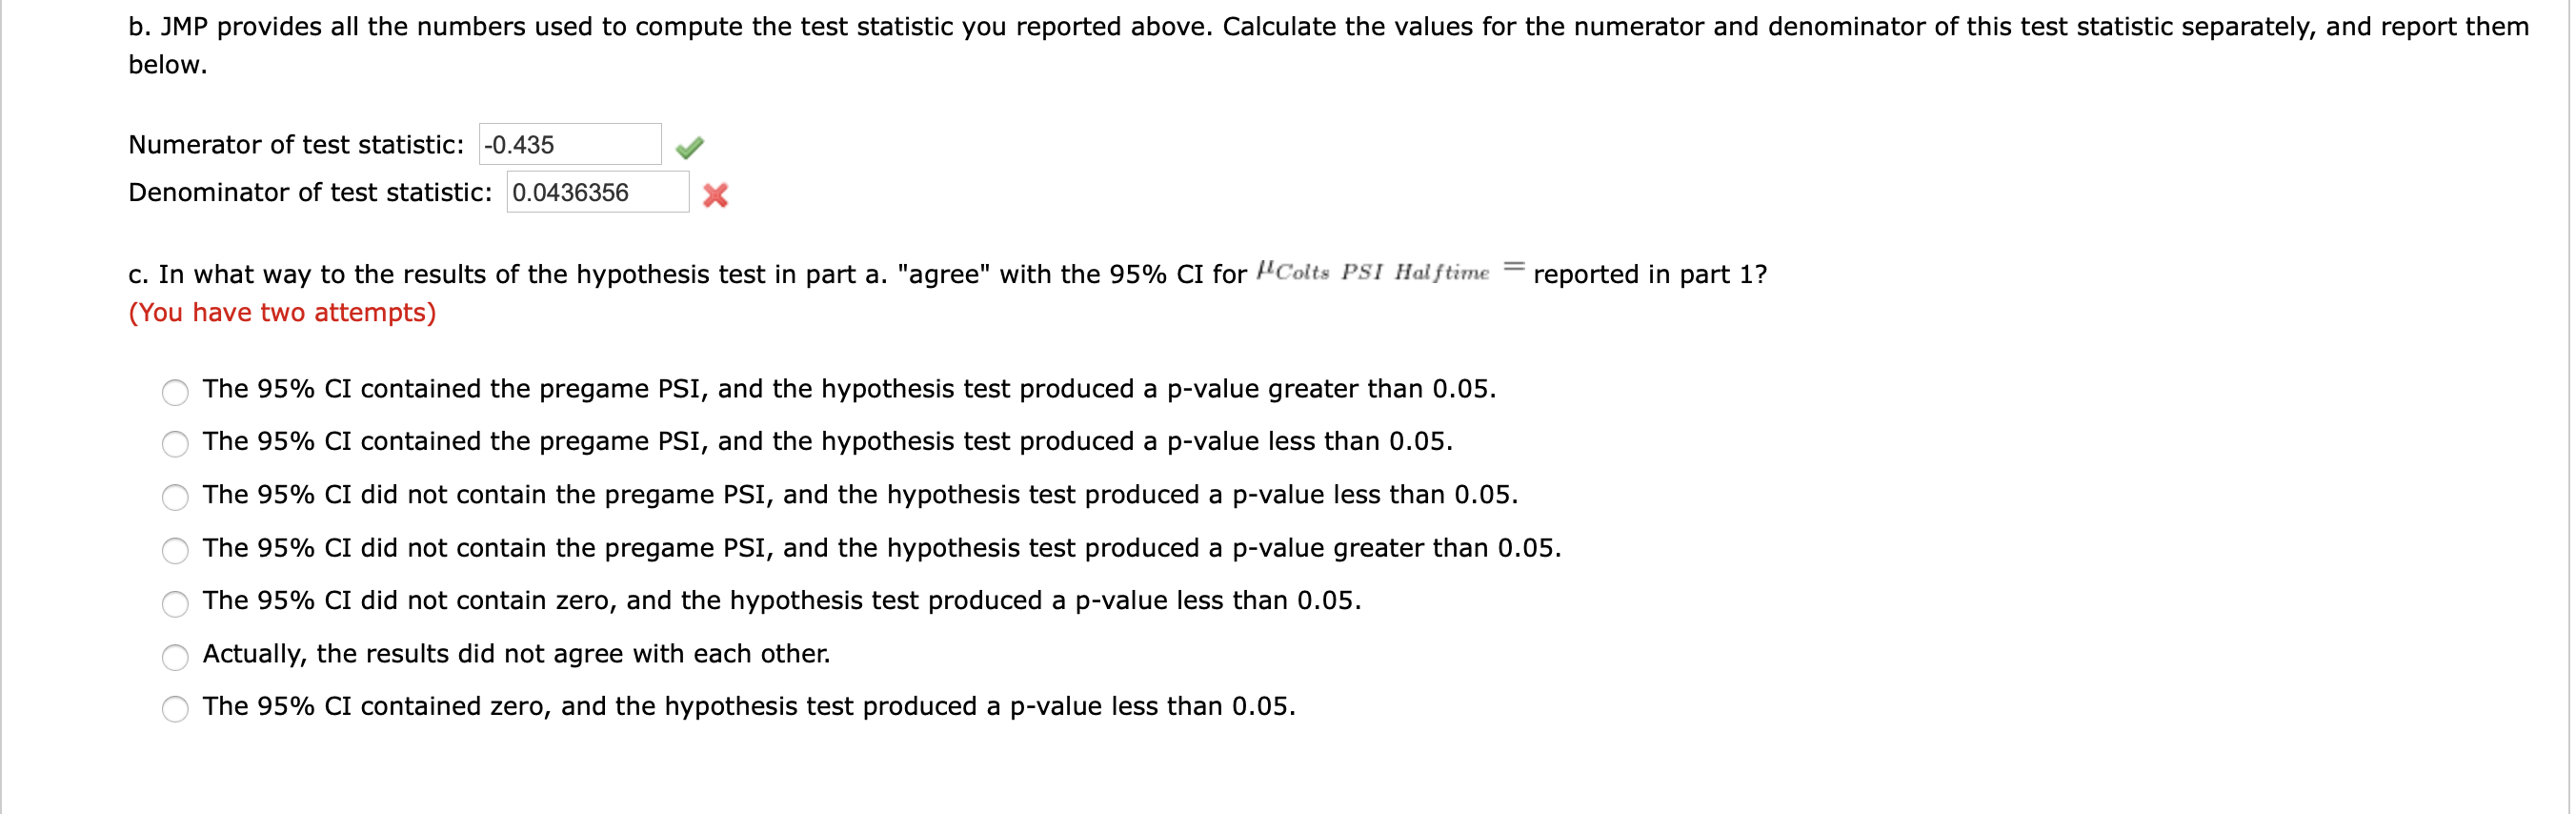
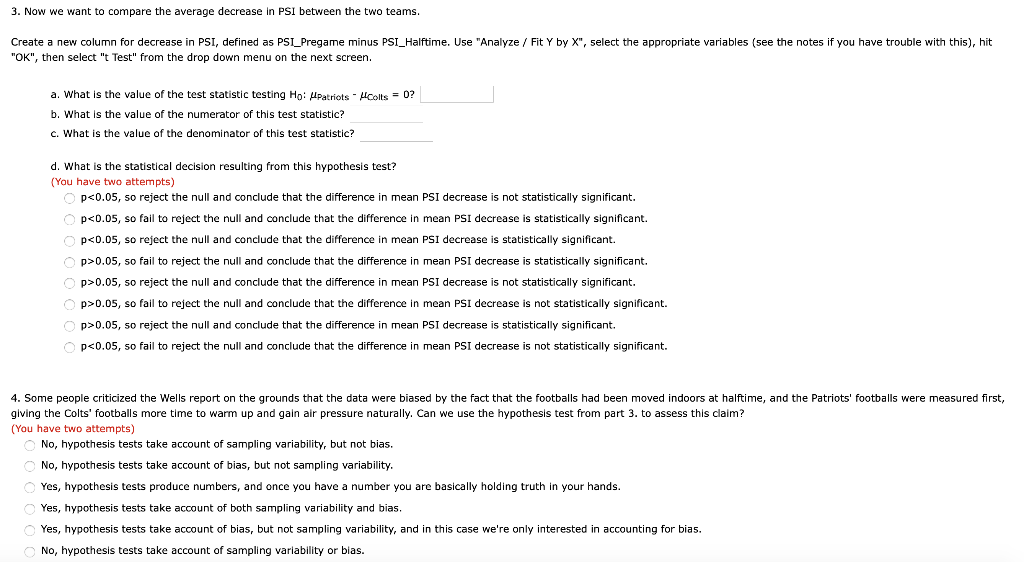
Deflategate5.jmp TO PSI_Prega PSI_Halftim Team me e 1 P 2 P 3 P 4 P 12.5 12.5 12.5 12.5 12.5 12.5 12.5 11.57 10.84 11.08 10.92 11.14 11.58 11.79 11.08 1) 5 P 6 P ne 7 P 8P 12.5 12.5 12.5 9 P 10 P 11 P. 12 C 13 C 12.5 13 11.02 10.56 10.78 12.55 12.76 13 14 C 13 12.6 12.35 15 C 13 15 4 0 For this question, you will use JMP to analyze the Deflategate data set. This data set is based on the "Wells Report", outlining the finding from an investigation into whether there was strong evidence that the New England Patriots football team intentionally let air out of footballs during a playoff game in 2015. It is recommended that you read the .pdf document outlining what is in this data set before you begin. You can find this document on Canvas under "Additional Class Stuff / Data". Each student is randomly assigned one of 10 versions of this dataset. Your version is 5. Enter the numbers exactly as they appear in JMP. WebAssign is set to use three decimal place precision to determine if the answer is correct. 1. Report the values of the following: a. Mean halftime PSI for Colts = 12.565 b. Standard deviation of mean halftime PSI for Colts = 0.169 c. Standard error of mean halftime PSI for Colts = 0.0845 d. 95% CI for Colts PSI Halftime = 12.2961 to 12.8339 e. Mean halftime PSI for Patriots = 11.1236 f. Standard deviation of mean halftime PSI for Patriots = 0.3774 g. Standard error of mean halftime PSI for Patriots = 0.11378 h. 95% CI for Ipatriots PSI Halltime = 10.870 to 11.377 2. Suppose we'd like to know if the mean PSI for the Colts' footballs changed significantly from pregame to halftime. The pregame PSI for all Colts footballs was 13. a. Get JMP to perform test against: Ho: Colts PSI Halftime - 13 To do this in JMP, start from the Analyze / Distribution output you used to answer the questions in part 1, then click the red arrow by "PSI_Halftime" and select "Test Means". Test statistic: -5.1479 P-value: 0.014208 b. JMP provides all the numbers used to compute the test statistic you reported above. Calculate the values for the numerator and denominator of this test statistic separately, and report them below. Numerator of test statistic: -0.435 Denominator of test statistic: 0.0436356 x c. In what way to the results of the hypothesis test in part a. "agree" with the 95% CI for Colts PSI Halftime = reported in part 1? (You have two attempts) The 95% CI contained the pregame PSI, and the hypothesis test produced a p-value greater than 0.05. The 95% CI con ained the pregame PSI, and the hypothesis test produced a p-value less than 0.05. The 95% CI did not contain the pregame PSI, and the hypothesis test produced a p-value less than 0.05. The 95% CI did not contain the pregame PSI, and the hypothesis test produced a p-value greater than 0.05. The 95% CI did not contain zero, and the hypothesis test produced a p-value less than 0.05. Actually, the results did not agree with each other. The 95% CI contained zero, and the hypothesis test produced a p-value less than 0.05. 3. Now we want to compare the average decrease in PSI between the two teams. Create a new column for decrease in PSI, defined as PSI_Pregame minus PSI_Halftime. Use "Analyze / Fit Y by X", select the appropriate variables (see the notes if you have trouble with this), hit "OK", then select "t Test" from the drop down menu on the next screen. a. What the value of the test statistic testing Ho: MPatriots - Colts = 0? b. What is the value of the numerator of this test statistic? c. What is the value of the denominator of this test statistic? d. What is the statistical decision resulting from this hypothesis test? (You have two attempts) Op0.05, so fail to reject the null and conclude that the difference in mean PSI decrease is statistically significant. Op>0.05, so reject the null and conclude that the difference in mean PSI decrease is not statistically significant. Op>0.05, so fail to reject the null and conclude that the difference in mean PSI decrease is not statistically significant. Op>0.05, so reject the null and conclude that the difference in mean PSI decrease is statistically significant. p0.05, so fail to reject the null and conclude that the difference in mean PSI decrease is statistically significant. Op>0.05, so reject the null and conclude that the difference in mean PSI decrease is not statistically significant. Op>0.05, so fail to reject the null and conclude that the difference in mean PSI decrease is not statistically significant. Op>0.05, so reject the null and conclude that the difference in mean PSI decrease is statistically significant. p


