

Question: For year 2020, CALCULATE THE: - Current Ratio - Quick Ratio - Average Collection Period - Inventory Turnover - Operating Return on Assets - Operating
For year 2020, CALCULATE THE:
- Current Ratio
- Quick Ratio
- Average Collection Period
- Inventory Turnover
- Operating Return on Assets
- Operating Profit Margin
- Total asset Turnover
- Fixed Asset Turnover
- Debt Ratio
- Times Interest Earned
- Return on Equity
PLEASE PROVIDE INFORMATION ABOUT WHERE YOU GET THE CURRENT ASSETS, CURRENT LIABILITIES, ETC.
SHOW CALCULATIONS!!!!
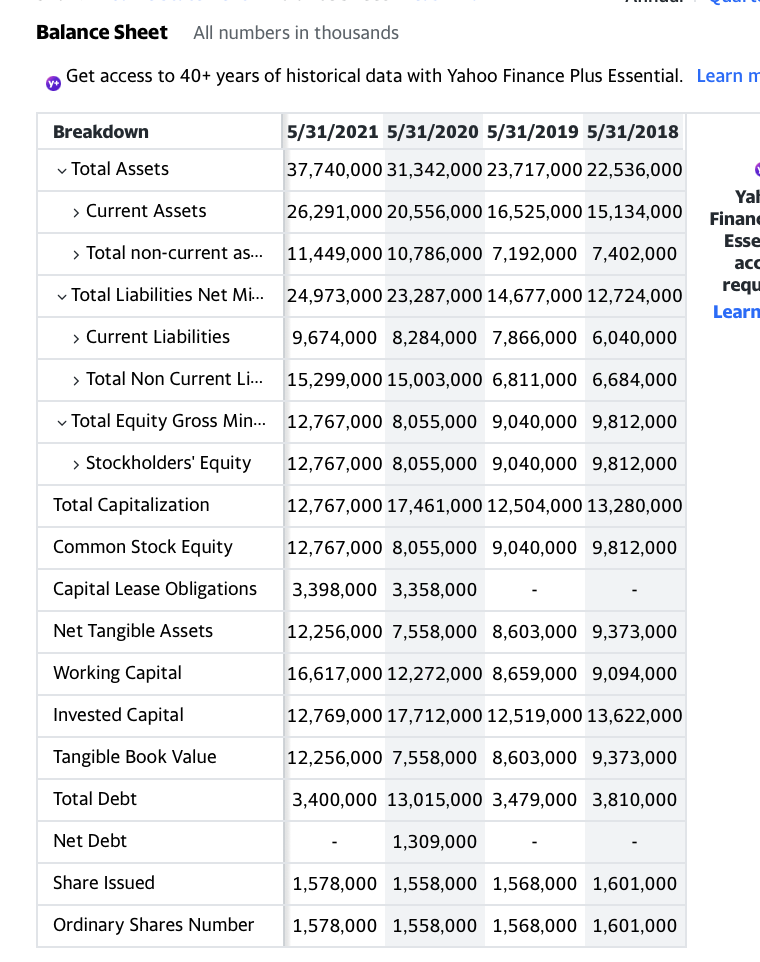
Balance Sheet All numbers in thousands V Get access to 40+ years of historical data with Yahoo Finance Plus Essential. Learn m Breakdown 5/31/2021 5/31/2020 5/31/2019 5/31/2018 Total Assets 37,740,000 31,342,000 23,717,000 22,536,000 > Current Assets 26,291,000 20,556,000 16,525,000 15,134,000 > Total non-current as... 11,449,000 10,786,000 7,192,000 7,402,000 Yal Finand Esse requ Learn Total Liabilities Net Mi... 24,973,000 23,287,000 14,677,000 12,724,000 > Current Liabilities 9,674,000 8,284,000 7,866,000 6,040,000 > Total Non Current Li... 15,299,000 15,003,000 6,811,000 6,684,000 Total Equity Gross Min... 12,767,000 8,055,000 9,040,000 9,812,000 > Stockholders' Equity 12,767,000 8,055,000 9,040,000 9,812,000 Total Capitalization 12,767,000 17,461,000 12,504,000 13,280,000 Common Stock Equity 12,767,000 8,055,000 9,040,000 9,812,000 Capital Lease Obligations 3,398,000 3,358,000 Net Tangible Assets 12,256,000 7,558,000 8,603,000 9,373,000 Working Capital 16,617,000 12,272,000 8,659,000 9,094,000 Invested Capital 12,769,000 17,712,000 12,519,000 13,622,000 Tangible Book Value 12,256,000 7,558,000 8,603,000 9,373,000 Total Debt 3,400,000 13,015,000 3,479,000 3,810,000 Net Debt 1,309,000 Share Issued 1,578,000 1,558,000 1,568,000 1,601,000 Ordinary Shares Number 1,578,000 1,558,000 1,568,000 1,601,000 Balance Sheet All numbers in thousands V Get access to 40+ years of historical data with Yahoo Finance Plus Essential. Learn m Breakdown 5/31/2021 5/31/2020 5/31/2019 5/31/2018 Total Assets 37,740,000 31,342,000 23,717,000 22,536,000 > Current Assets 26,291,000 20,556,000 16,525,000 15,134,000 > Total non-current as... 11,449,000 10,786,000 7,192,000 7,402,000 Yal Finand Esse requ Learn Total Liabilities Net Mi... 24,973,000 23,287,000 14,677,000 12,724,000 > Current Liabilities 9,674,000 8,284,000 7,866,000 6,040,000 > Total Non Current Li... 15,299,000 15,003,000 6,811,000 6,684,000 Total Equity Gross Min... 12,767,000 8,055,000 9,040,000 9,812,000 > Stockholders' Equity 12,767,000 8,055,000 9,040,000 9,812,000 Total Capitalization 12,767,000 17,461,000 12,504,000 13,280,000 Common Stock Equity 12,767,000 8,055,000 9,040,000 9,812,000 Capital Lease Obligations 3,398,000 3,358,000 Net Tangible Assets 12,256,000 7,558,000 8,603,000 9,373,000 Working Capital 16,617,000 12,272,000 8,659,000 9,094,000 Invested Capital 12,769,000 17,712,000 12,519,000 13,622,000 Tangible Book Value 12,256,000 7,558,000 8,603,000 9,373,000 Total Debt 3,400,000 13,015,000 3,479,000 3,810,000 Net Debt 1,309,000 Share Issued 1,578,000 1,558,000 1,568,000 1,601,000 Ordinary Shares Number 1,578,000 1,558,000 1,568,000 1,601,000
Step by Step Solution
There are 3 Steps involved in it

Get step-by-step solutions from verified subject matter experts