

Question: Force Conversion Graph Background Scientific data, such as data collected from wind tunnels, is usually in SI (Systme International) units. However, much of the manufacturing
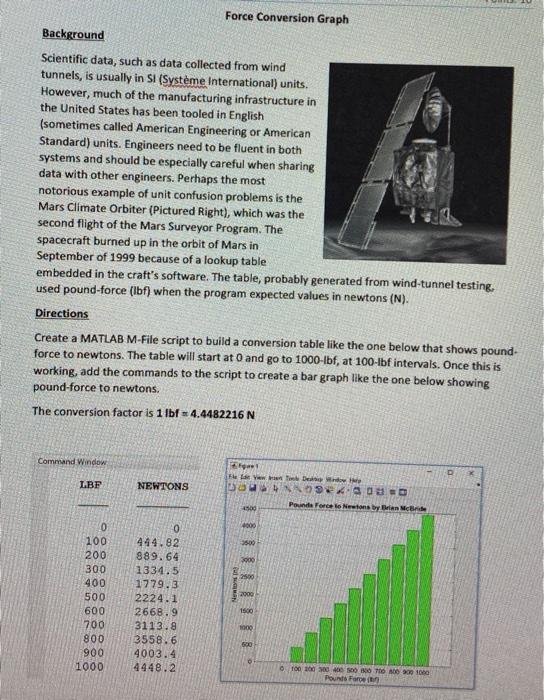
Force Conversion Graph Background Scientific data, such as data collected from wind tunnels, is usually in SI (Systme International) units. However, much of the manufacturing infrastructure in the United States has been tooled in English (sometimes called American Engineering or American Standard) units. Engineers need to be fluent in both systems and should be especially careful when sharing data with other engineers. Perhaps the most notorious example of unit confusion problems is the Mars Climate Orbiter (Pictured Right), which was the second flight of the Mars Surveyor Program. The spacecraft burned up in the orbit of Mars in September of 1999 because of a lookup table embedded in the craft's software. The table, probably generated from wind-tunnel testing, used pound-force (lbf) when the program expected values in newtons (N). Directions Create a MATLAB M-File script to build a conversion table like the one below that shows pound- force to newtons. The table will start at 0 and go to 1000-ibf, at 100-lbf intervals. Once this is working, add the commands to the script to create a bar graph like the one below showing pound-force to newtons. The conversion factor is 1 lbf - 4.4482216 N Command Window LBF NEWTONS Few Dew 09:00 - PoundaForce loon by Biance 4000 3500 3000 2500 0 100 200 300 400 500 600 700 800 900 1000 2000 0 444.82 889.64 1334.5 1779.3 2224.1 2668.9 3113.8 3558.6 4003.4 4448.2 1500 1000 500 of 100 00 00 00 00 00 1060 Pounds Faroe
Step by Step Solution
There are 3 Steps involved in it

Get step-by-step solutions from verified subject matter experts