

Question: FORECAST ANALYSIS SUMMARY OUTPUT The table below shows the relationship between forecasted Truckload (TL) rates (dependent variable or Y) and driver wages, equipment types, and
FORECAST ANALYSIS SUMMARY OUTPUT
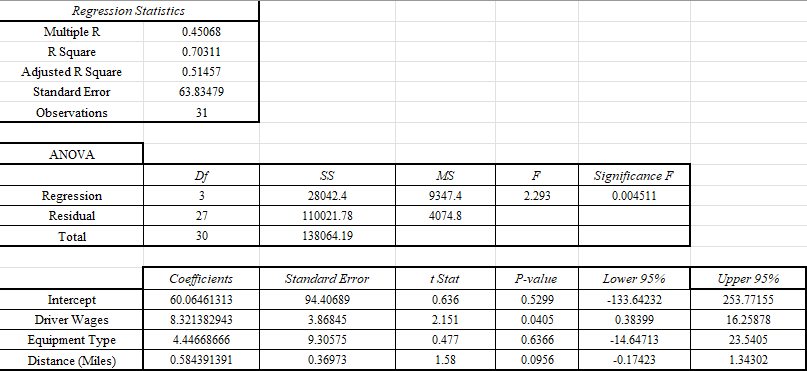
The table below shows the relationship between forecasted Truckload (TL) rates (dependent variable or Y) and driver wages, equipment types, and distance (the independent of X variables). Please use the information in this table to answer the following questions.
What is the regression line?
Is your model a significant model? How do you know?
How much variation in TL rates are explained by driver wages, equipment types, and distance? What is the technical name called for this variation?
Which of the independent variables are significant predictors of Truckload rates (TL) at alpha = 95%?
Which of the independent variables are significant predictors of Truckload rates (TL) at alpha = 90%?
Interpret the coefficients of your significant independent variables at alpha= 95%.
The following are the VIF scores of the independent variables. Driver wages = 3.265; Equipment Types = 11.354; Distance (Miles) = 18.653 What do you conclude & what is the solution?
Regression Statistics Multiple R 0.45068 R Square 0.70311 Adjusted R Square 0.51457 Standard Error 63.83479 Observations 31 ANOVA SS MS F Df 3 Significance F 0.004511 28042.4 2.293 Regression Residual 9347.4 4074.8 27 110021.78 Total 30 138064.19 Standard Error P-value Coeficients 60.06461313 8.321382943 Upper 95% 253.77155 0.5299 94.40689 3.86845 t Stat 0.636 2.151 0.477 0.0405 Intercept Driver Wages Equipment Type Distance (Miles) Lower 95% -133.64232 0.38399 -14.64713 -0.17423 16.25878 4.44668666 9.30575 0.6366 23.5405 1.34302 0.584391391 0.36973 1.58 0.0956Step by Step Solution
There are 3 Steps involved in it

Get step-by-step solutions from verified subject matter experts