

Question: Forecast - Conduct a forecast by choosing and using simple regression analysis given data as an input, and evaluate the forecast result by the criteria
Forecast - Conduct a forecast by choosing and using simple regression analysis given data as an input, and evaluate the forecast result by the criteria of the regression equation. Use the following scenario and data:
? Scenario - FlyHigh airlines is test marketing their boxed snacks sold on their short flights. FlyHigh selected 15 different markets for a quarter-long sales test. For the entire quarter, the boxed snack was sold onboard at 4 different prices starting at $8.50 a box. Data was collected on the average income of the passenger aboard the flights. Data was also collected that represented a snack purchased off-board (presumably in the airport) and carried on by the passenger. The amount of passengers that this boxed snack was available to and the ultimate quantity sold was also collected.
flight marketPrice of snack sold on airplaneaverage income of passengerprice of snack (presumably carried by passenger)amount of passengers
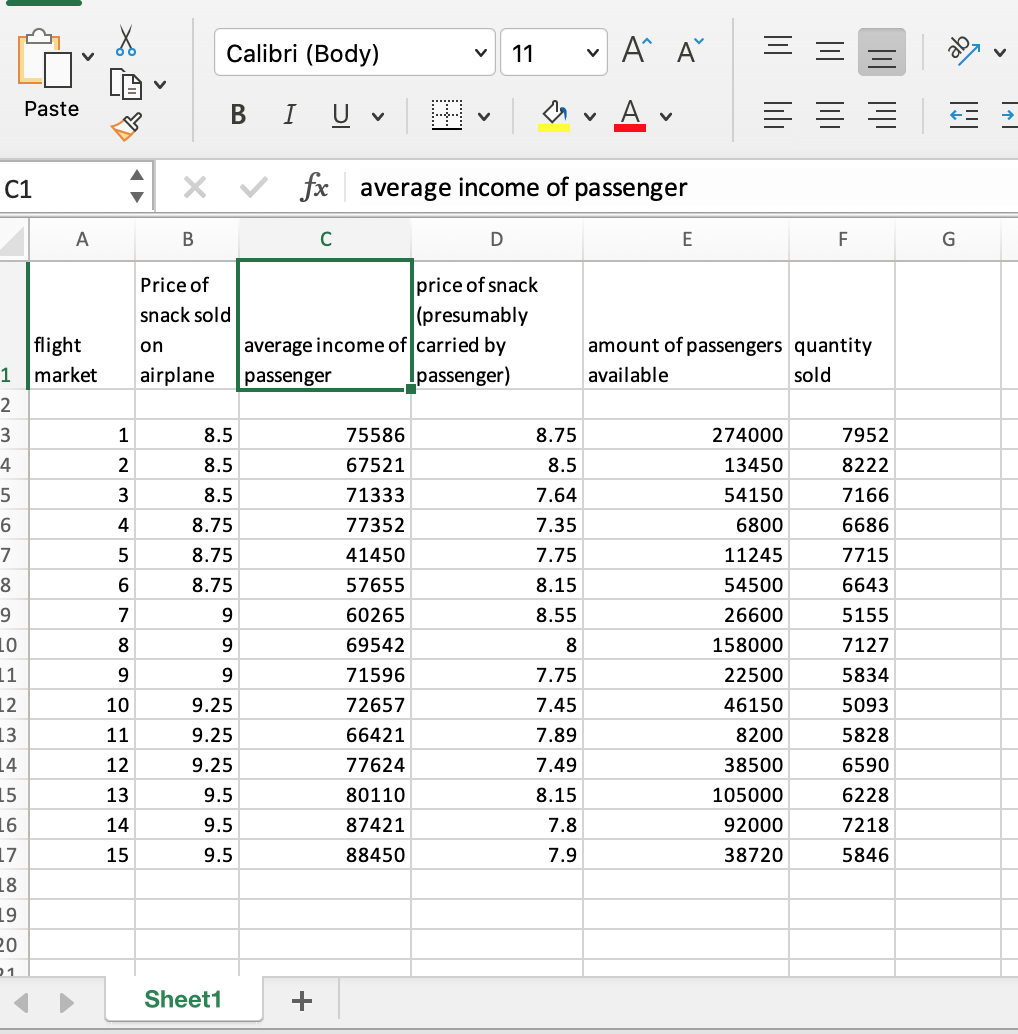
Calibri (Body) 11 AA Paste BI UV A = C1 X v fx average income of passenger A B C D E F G Price of price of snack snack sold (presumably flight or average income of carried by amount of passengers quantity market airplane passenger passenger) available sold 8.5 75586 8.75 274000 7952 8.5 67521 8.5 13450 8222 8.5 71333 7.64 54150 7166 O UA W N Y 8.75 77352 7.35 6800 6686 8.75 41450 7.75 11245 7715 8.75 57655 8.15 54500 6643 7 9 60265 8.55 26600 5155 8 9 69542 8 158000 7127 9 9 71596 7.75 22500 5834 10 9.25 72657 7.45 46150 5093 11 9.25 66421 7.89 8200 5828 12 9.25 77624 7.49 38500 6590 13 9.5 80110 8.15 105000 6228 14 9.5 87421 7.8 92000 7218 15 9.5 88450 7.9 38720 5846 9 - O Sheet1 +
Step by Step Solution
There are 3 Steps involved in it

Get step-by-step solutions from verified subject matter experts