

Question: Forecast DPs 2020 income statement and balance sheet using the following relations ($ millions). Assume total revenues grow by 13% in 2020. All other percentages
Forecast DPs 2020 income statement and balance sheet using the following relations ($ millions).
Assume total revenues grow by 13% in 2020. All other percentages (other than sales growth and provision for income taxes) are based on historic percent of total revenues.
CAPEX for 2020 will be 1.1% of total revenue, and depreciation will be $110.6 million.
Goodwill, long-term debt, preferred stock, common stock, and Accumulated other comprehensive loss will not change for the year.
The company will acquire intangibles equal to 2.9% of total revenues and will record amortization expense of $165.7 million.
Income taxes will be 25% of pretax income and income taxes payable will be 7.7% of 2020 tax expense.
The company will award $100.4 million of stock-based compensation, which increases Capital in excess of par value by the same amount.
Assume that the company routinely includes this form of compensation in operating expenses each year.
The company will continue its stock repurchases. DP will repurchase $450 million of treasury stock. Dividends will be $833.60 in 2020, and dividends payable will be 26.3% of dividends.
Note: When you are required to compute the percentage used for your forecasting assumptions, round the percentage to one decimal place and use that rounded figure to compute the forecasted amount. For example, assume that Actual Accounts receivable, net divided Actual Total revenues equals 0.1720824. This factor should be rounded to 17.2% before computing your forecasted amount for Accounts receivable, net.
Note: Round your forecasted answers to one decimal place (for example, enter 14.6 for 14.55555). Use rounded amounts to compute any subtotals and totals.
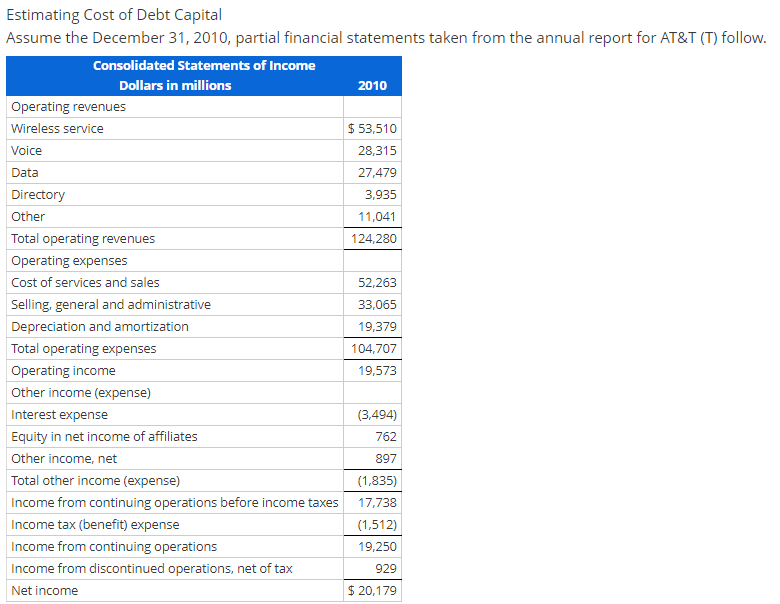
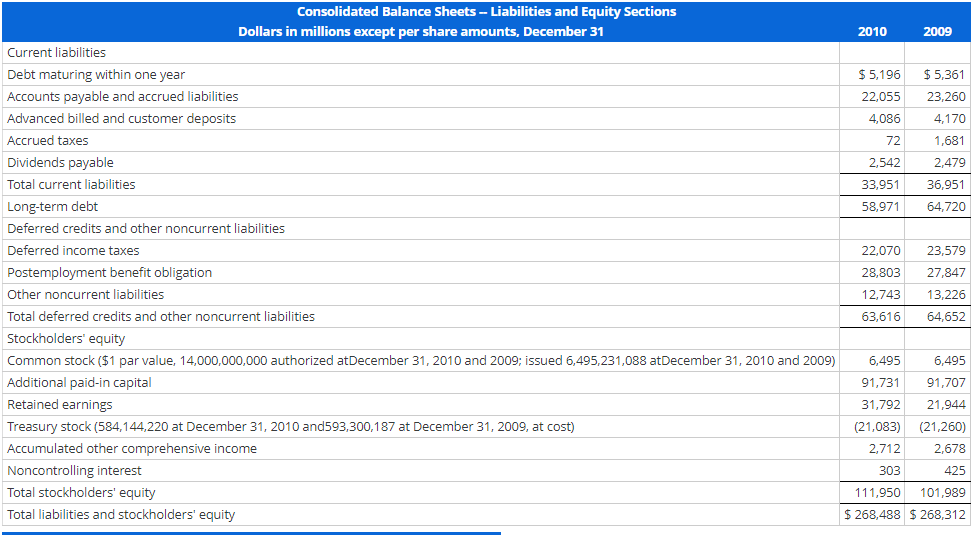
Estimating Cost of Debt Capital Assume the December 31, 2010, partial financial statements taken from the annual report for AT&T (T) follow. Consolidated Statements of Income Dollars in millions 2010 Operating revenues Wireless service $53,510 Voice 28,315 Data 27,479 Directory 3,935 Other 11,041 Total operating revenues 124,280 Operating expenses Cost of services and sales 52,263 Selling, general and administrative 33,065 Depreciation and amortization 19,379 Total operating expenses 104,707 Operating income 19,573 Other income (expense) Interest expense (3,494) Equity in net income of affiliates Other income, net Total other income (expense) (1,835) Income from continuing operations before income taxes 17,738 Income tax (benefit) expense (1,512) Income from continuing operations 19,250 Income from discontinued operations, net of tax 929 Net income $ 20,179 762 897 2010 2009 $5,196 22,055 4,086 $ 5,361 23,260 4,170 1,681 2,479 72 2.542 33,951 58,971 36,951 64,720 Consolidated Balance Sheets -- Liabilities and Equity Sections Dollars in millions except per share amounts, December 31 Current liabilities Debt maturing within one year Accounts payable and accrued liabilities Advanced billed and customer deposits Accrued taxes Dividends payable Total current liabilities Long-term debt Deferred credits and other noncurrent liabilities Deferred income taxes Postemployment benefit obligation Other noncurrent liabilities Total deferred credits and other noncurrent liabilities Stockholders' equity Common stock ($1 par value, 14,000,000,000 authorized at December 31, 2010 and 2009; issued 6,495,231,088 atDecember 31, 2010 and 2009) Additional paid-in capital Retained earnings Treasury stock (584,144,220 at December 31, 2010 and593,300,187 at December 31, 2009, at cost) Accumulated other comprehensive income Noncontrolling interest Total stockholders' equity Total liabilities and stockholders' equity 22,070 28,803 12,743 63,616 23,579 27,847 13,226 64,652 6,495 6,495 91,731 91,707 31,792 21,944 (21,083) (21,260) 2,678 303 425 111,950 101,989 $ 268,488 $ 268,312 2.712 Estimating Cost of Debt Capital Assume the December 31, 2010, partial financial statements taken from the annual report for AT&T (T) follow. Consolidated Statements of Income Dollars in millions 2010 Operating revenues Wireless service $53,510 Voice 28,315 Data 27,479 Directory 3,935 Other 11,041 Total operating revenues 124,280 Operating expenses Cost of services and sales 52,263 Selling, general and administrative 33,065 Depreciation and amortization 19,379 Total operating expenses 104,707 Operating income 19,573 Other income (expense) Interest expense (3,494) Equity in net income of affiliates Other income, net Total other income (expense) (1,835) Income from continuing operations before income taxes 17,738 Income tax (benefit) expense (1,512) Income from continuing operations 19,250 Income from discontinued operations, net of tax 929 Net income $ 20,179 762 897 2010 2009 $5,196 22,055 4,086 $ 5,361 23,260 4,170 1,681 2,479 72 2.542 33,951 58,971 36,951 64,720 Consolidated Balance Sheets -- Liabilities and Equity Sections Dollars in millions except per share amounts, December 31 Current liabilities Debt maturing within one year Accounts payable and accrued liabilities Advanced billed and customer deposits Accrued taxes Dividends payable Total current liabilities Long-term debt Deferred credits and other noncurrent liabilities Deferred income taxes Postemployment benefit obligation Other noncurrent liabilities Total deferred credits and other noncurrent liabilities Stockholders' equity Common stock ($1 par value, 14,000,000,000 authorized at December 31, 2010 and 2009; issued 6,495,231,088 atDecember 31, 2010 and 2009) Additional paid-in capital Retained earnings Treasury stock (584,144,220 at December 31, 2010 and593,300,187 at December 31, 2009, at cost) Accumulated other comprehensive income Noncontrolling interest Total stockholders' equity Total liabilities and stockholders' equity 22,070 28,803 12,743 63,616 23,579 27,847 13,226 64,652 6,495 6,495 91,731 91,707 31,792 21,944 (21,083) (21,260) 2,678 303 425 111,950 101,989 $ 268,488 $ 268,312 2.712
Step by Step Solution
There are 3 Steps involved in it

Get step-by-step solutions from verified subject matter experts