

Question: Forecast how the projected numbers for the three years would affect revenues for the medical Center. Explain how these numbers allow the practice manager to
Forecast how the projected numbers for the three years would affect revenues for the medical Center. Explain how these numbers allow the practice manager to estimate the cash flow for the facility. Below you will find historical data and current data, as well as future forecast for a local medical Center of total patients seen.
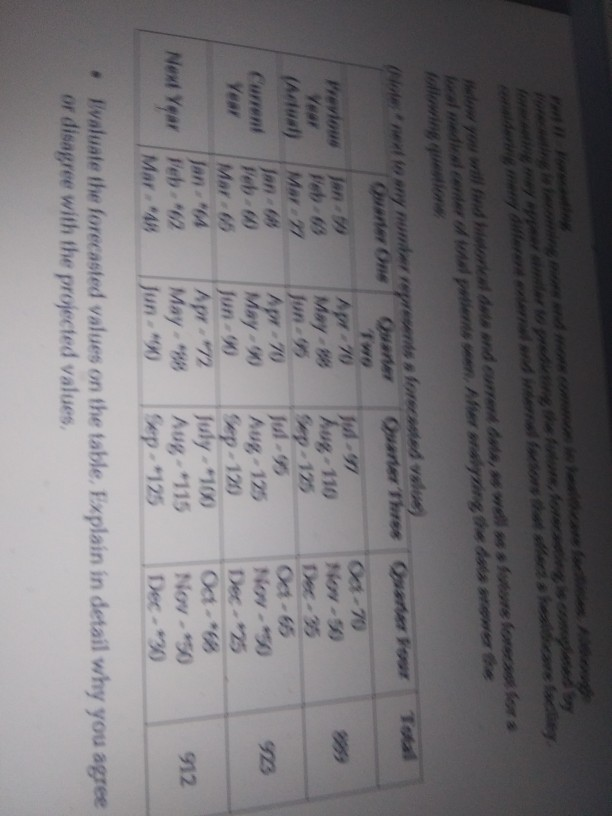
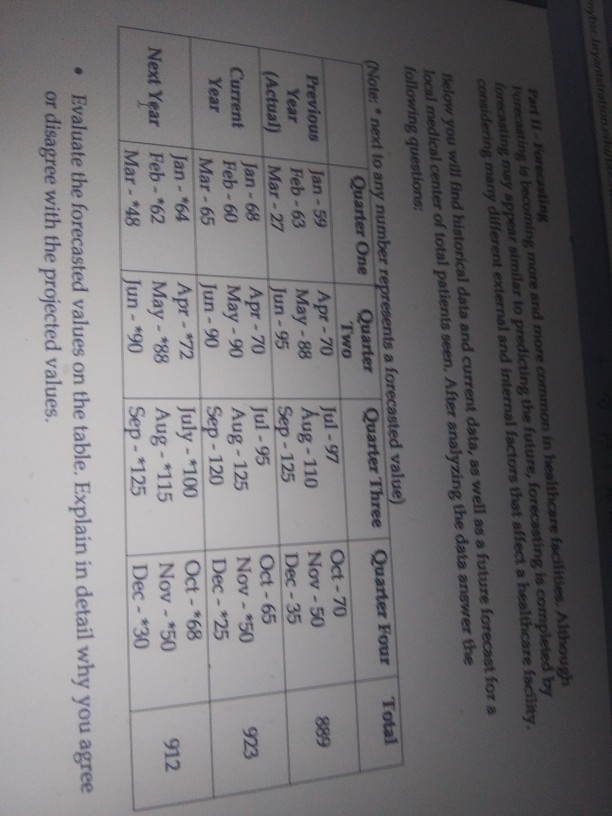
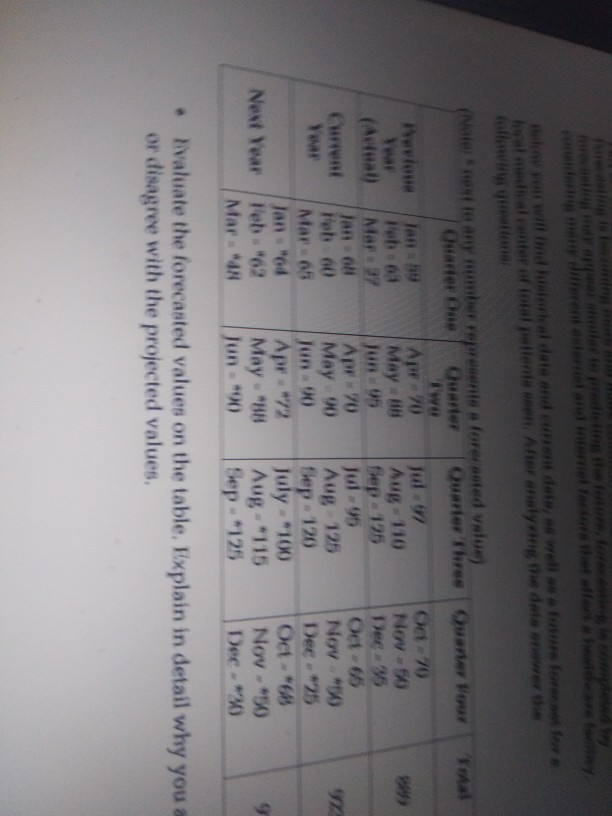
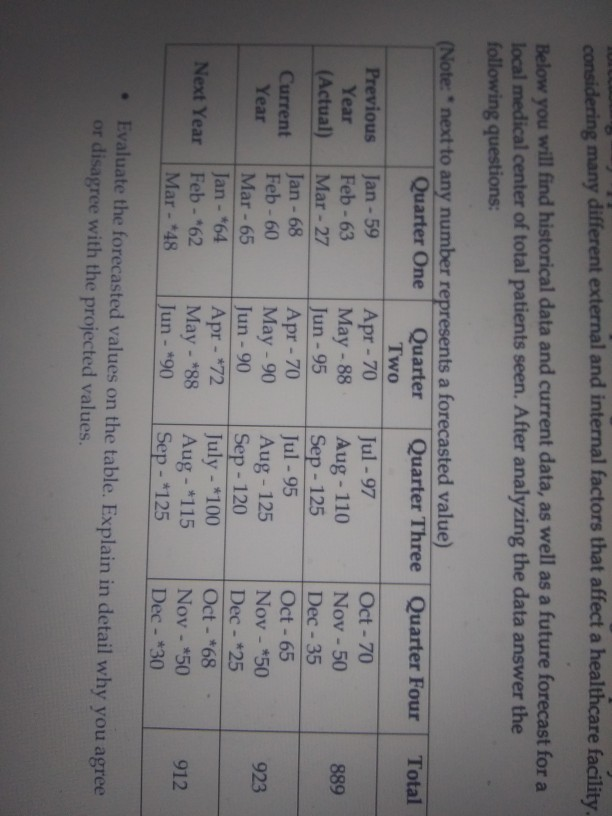
al media center and patients on the bring the data mower the Planet in any number representes forecasted values C-70 Previous Mary hug - 110 (Actual) Morn Mar 05 Jan New Year Peb 02 Mar 48 Apr 70 May 4 Juny Apr 12 May - Jun ) hug - 125 Sep - 129 July 100 hug,"115 Sep - 125 912 Nov - 450 Dec-20 Evaluate the forecasted values on the table. Explain in detail why you agree or disagree with the projected values, Partll-Vorecasting Forecasting to becoming more and more common in healthcare facilities. Although forecasting may appear similar to predicting the future, forecasting is completed by considering many different external and internal factors that affed a healthcare facility. Below you will find historical data and current data, as well as a future forecast for a local medical center of total patients seen. After analyzing the data angwer the following questions: Total 889 (Note: * next to any number represents a forecasted value) Quarter One Quarter Quarter Three Quarter Four Two Previous Jan - 59 Apr-70 Jul - 97 Oct - 70 Year Feb-63 May-88 Aug - 110 Nov - 50 (Actual) Mar - 27 Jun - 95 Sep - 125 Dec - 35 Current Jan -68 Apr - 70 Jul - 95 Oct - 65 Feb - 60 Year May - 90 Aug - 125 Nov - *50 Mar - 65 Jun - 90 Sep - 120 Dec - 25 Jan - "64 Apr - #12 July - 100 Oct - *68 Next Year Feb - *62 May - *88 Aug - 115 Nov - *50 Mar - 48 Jun - 190 Sep - 1125 Dec - *30 923 912 Evaluate the forecasted values on the table. Explain in detail why you agree or disagree with the projected values. Now - 50 Dee 195 (Mater en te any number represents a forecasted value) Ostarter One Previous lang Apr10 May - Aug - 110 Mar 27 fep_125 (Current Apr 70 May 90 Aug 125 Mar 05 Jun-90 flep - 120 Jan 64 Apr. 72 Next Year Feb.62 July - 100 May - HB Aug -*115 Mar: "N Jun - 90 Sep. 125 Nov. 30 Dec -*25 Oct 68 No - 50 Dee." Evaluate the forecasted values on the table. Explain in detail why you a or disagree with the projected values, considering many different external and internal factors that affect a healthcare facility. Below you will find historical data and current data, as well as a future forecast for a local medical center of total patients seen. After analyzing the data answer the following questions: Total 889 (Note: * next to any number represents a forecasted value) Quarter One Quarter Quarter Three Quarter Four Two Previous Jan - 59 Apr - 70 Jul - 97 Oct - 70 Year Feb - 63 May - 88 Aug - 110 Nov - 50 (Actual) Mar - 27 Jun - 95 Sep - 125 Dec - 35 Current Jan - 68 Apr - 70 Jul - 95 Oct - 65 Feb - 60 Year May - 90 Aug - 125 Nov - *50 Mar - 65 Jun - 90 Sep - 120 Dec - 25 Jan - *64 Apr - *72 July -*100 Oct - *68 Next Year Feb - *62 May - *88 Aug - *115 Nov - 450 Mar - 48 Jun - *90 Sep - *125 Dec - *30 923 912 Evaluate the forecasted values on the table. Explain in detail why you agree or disagree with the projected values
Step by Step Solution
There are 3 Steps involved in it
1 Expert Approved Answer
Step: 1 Unlock

Question Has Been Solved by an Expert!
Get step-by-step solutions from verified subject matter experts
Step: 2 Unlock
Step: 3 Unlock