

Question: Forecast Q1 Unit Q2 Unit 12-mth Part No. Q3 Unit Sales Q4 Unit Plan Sales Demand Sales Sales Raw % Bill % 10.2/day 9/28/2003 1/4/2004
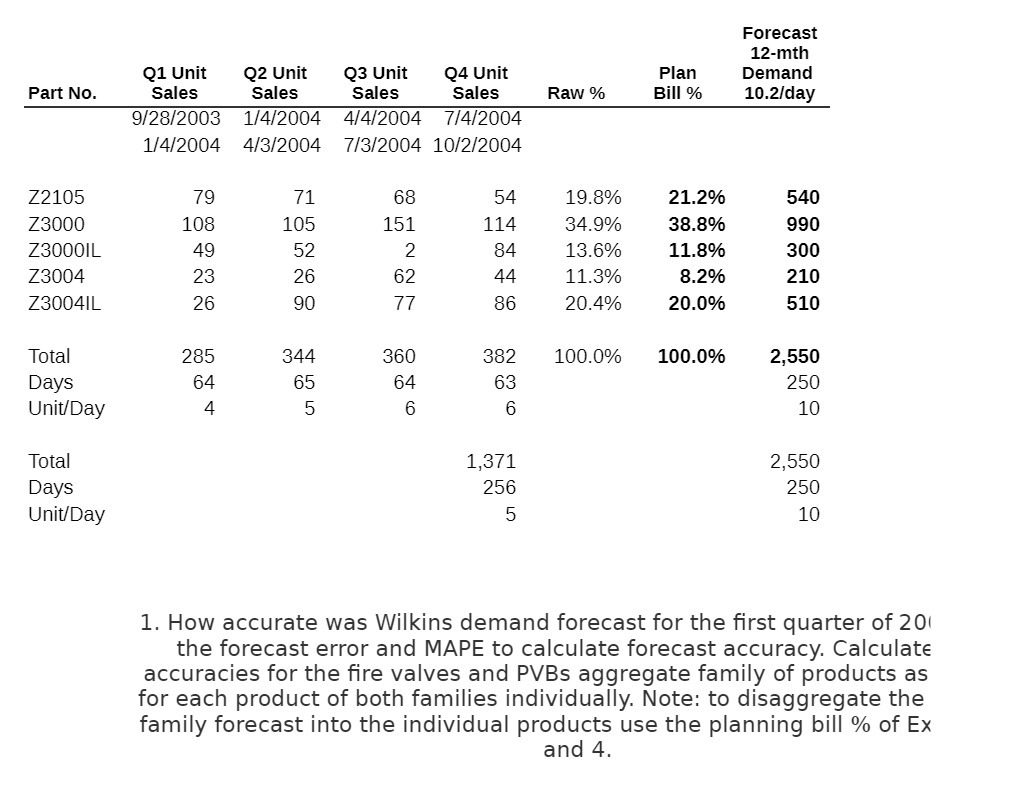
Forecast Q1 Unit Q2 Unit 12-mth Part No. Q3 Unit Sales Q4 Unit Plan Sales Demand Sales Sales Raw % Bill % 10.2/day 9/28/2003 1/4/2004 4/4/2004 7/4/2004 1/4/2004 4/3/2004 7/3/2004 10/2/2004 Z2105 79 71 68 54 19.8% 21.2% 540 Z3000 108 105 151 114 34.9% 38.8% 990 Z300OIL 49 52 2 84 13.6% 11.8% Z3004 300 23 26 62 44 11.3% 8.2% 210 Z3004IL 26 90 77 86 20.4% 20.0% 510 Total 285 344 360 382 100.0% 100.0% Days 2,550 64 65 64 63 Unit/Day 250 4 5 6 6 10 Total 1,371 2,550 Days 256 Unit/Day 250 5 10 1. How accurate was Wilkins demand forecast for the first quarter of 20 the forecast error and MAPE to calculate forecast accuracy. Calculate accuracies for the fire valves and PVBs aggregate family of products as for each product of both families individually. Note: to disaggregate the family forecast into the individual products use the planning bill % of Ex and 4
Step by Step Solution
There are 3 Steps involved in it

Get step-by-step solutions from verified subject matter experts