Question: Forecasted Income Statement (20 points: 5 for showing work, 15 for accuracy) DURA-CLEAR WINDOWS, LLC Proforma Income Statement 2020 2021 2022 2023 2024 2025 2026
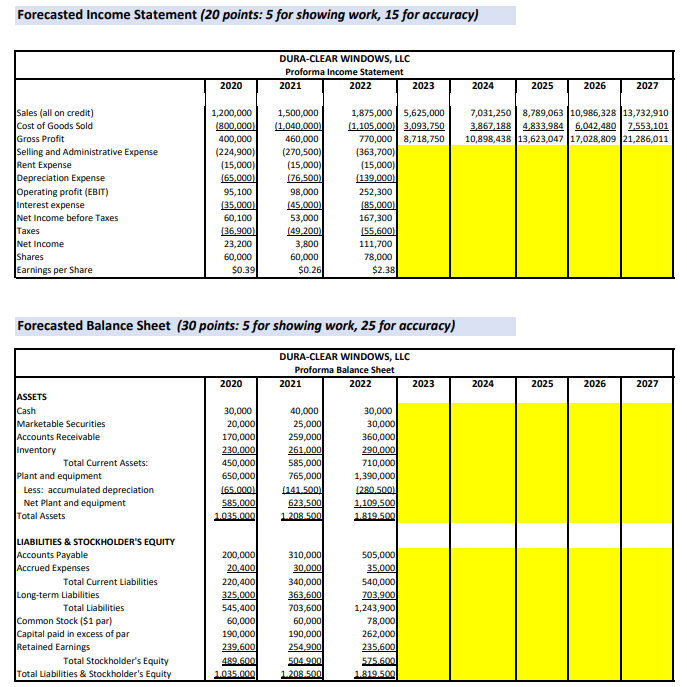
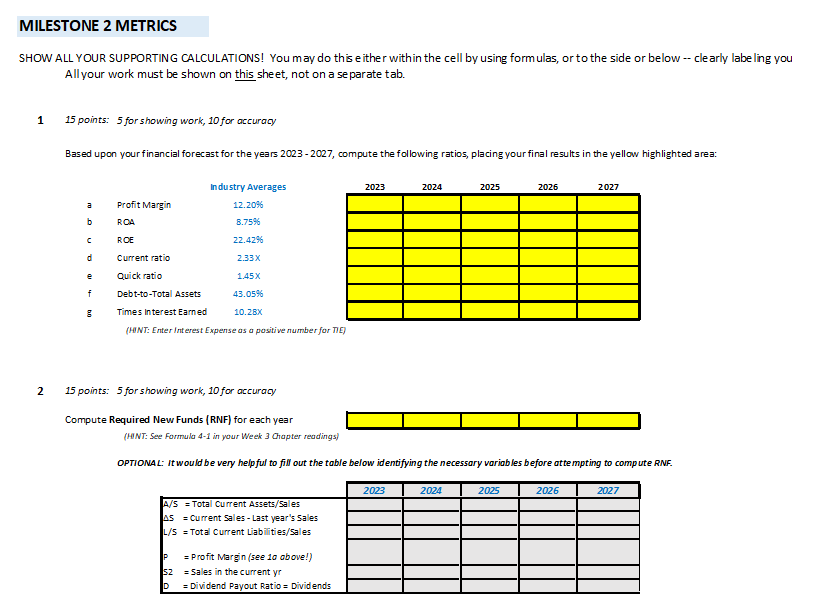
Forecasted Income Statement (20 points: 5 for showing work, 15 for accuracy) DURA-CLEAR WINDOWS, LLC Proforma Income Statement 2020 2021 2022 2023 2024 2025 2026 2027 Sales (all on credit) 1,200,000 1,500,000 1,875,000 | 5,625,000 7,031,250 8,789,063 10,986,328 13,732,910 Cost of Goods Sold (800,000) (1,040.000 (1, 105,000]| 3.093.750 3,867.186 4.833.984 6.042.480 Z.553,101 Gross Profit 400,000 460,000 770,000 8,718,750 10,898,438 13,623,047 17,028,809 21,286,011 Selling and Administrative Expense (224,900 (270,500 (363,700) Rent Expense (15,000] (15,000) [15,000) Depreciation Expense [65.000] (76 500 [139,000] Operating profit (EBIT) 95,100 98,000 252,300 nterest expense (35,000] (45,000) [85,000] Net Income before Taxes 60,100 53,000 167,300 Taxes (36.900 (49,200) (55,600) Net Income 23,200 3,800 111,700 Shares 60,000 60,000 78,000 Earnings per Share 50.39 $0.26 $2.38 Forecasted Balance Sheet (30 points: 5 for showing work, 25 for accuracy) DURA-CLEAR WINDOWS, LLC Proforma Balance Sheet 2020 2021 2022 2023 2024 2025 2026 2027 ASSETS Cash 30,000 40,000 30,000 Marketable Securities 20,000 25,000 30,000 Accounts Receivable 170,000 259,000 360,000 Inventory 230.000 261,000 290,000 Total Current Assets: 450,000 585,000 710,000 Plant and equipment 650,000 765,000 1,390,000 Less: accumulated depreciation (65.000) (141 5001 [280.500) Net Plant and equipment 585,000 623.500 1,109,500 Total Assets 1.035.000 1.208 500 1.819.500 LIABILITIES & STOCKHOLDER'S EQUITY Accounts Payable 200,000 310,000 505,000 Accrued Expenses 20.400 30.000 35,000 Total Current Liabilities 220,400 340,000 540,000 Long-term Liabilities 325,000 363.600 703,900 Total Liabilities 545,400 703,600 1,243,900 Common Stock ($1 par) 60,000 60,000 78,000 Capital paid in excess of par 190,000 190,000 262,000 Retained Earnings 239,600 254,900 235,600 Total Stockholder's Equity 489.600 504 900 575.600 Total Liabilities & Stockholder's Equity 1.035.000 L.208 500 1.819.500MILESTONE 2 METRICS SHOW ALL YOUR SUPPORTING CALCULATIONS! You may do this either within the cell by using formulas, or to the side or below -- clearly labeling you All your work must be shown on this sheet, not on a separate tab. 1 15 points: 5 for showing work, 10 for accuracy Based upon your financial forecast for the years 2023- 2027, compute the following ratios, placing your final results in the yellow highlighted area: Industry Averages Profit Margin 12.20%% ROA 6.75%% ROE 22.4216 Current ratio 2.33X Quick ratio 1.45X Debt-to-Total Assets 43.05%% Times Interest Earned 10.28X (HINT: Enter Interest Expense as a positive number for DIE) 2 15 points: 5 for showing work, 10 for accuracy Compute Required New Funds [RNF) for each year (HINT: See Formula 4-1 in your Week 3 Chapter readings) OPTIONAL: It would be very helpful to fill out the toble below identifying the necessary voriobles before attempting to compute RNF. 2023 2024 2025 2026 2027 A/5 = Total Current Assets/Sales 45 = Current Sales - Last year's Sales L/S = Total Current Liabilities/Sales F = Profit Margin (see 10 above!) 52 = Sales in the current yr = Dividend Payout Ratio = Dividends
Step by Step Solution
There are 3 Steps involved in it
1 Expert Approved Answer
Step: 1 Unlock
Question Has Been Solved by an Expert!
Get step-by-step solutions from verified subject matter experts
Step: 2 Unlock
Step: 3 Unlock
Students Have Also Explored These Related Finance Questions!