

Question: Forecasting and Estimating Share Value Using the DCF Model Following are the income statement and balance sheet for Intel Corporation. INTEL CORPORATION Consolidated Statements of
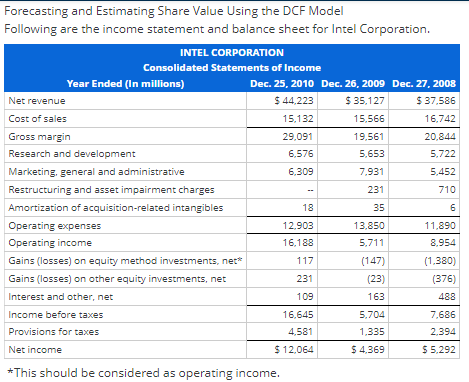
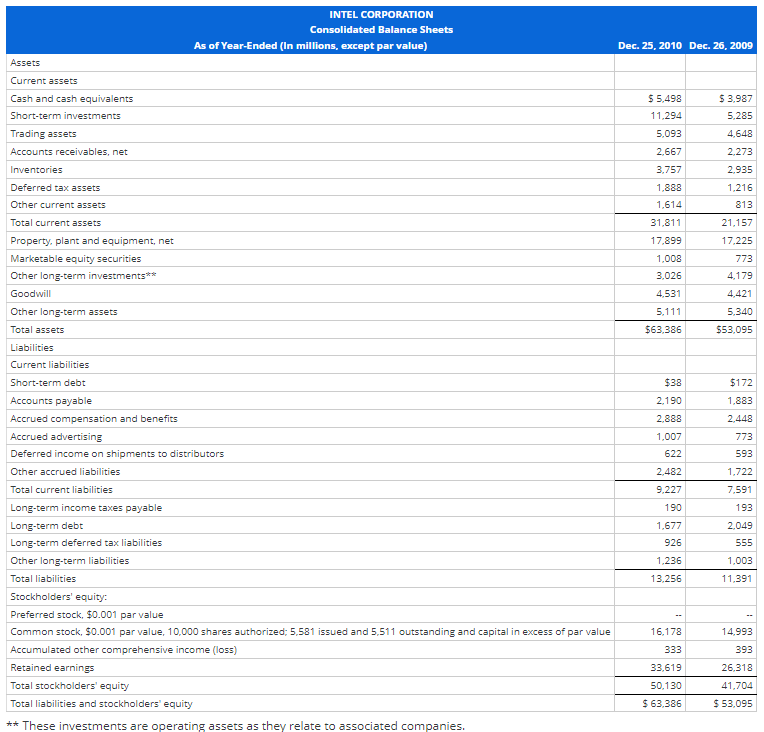
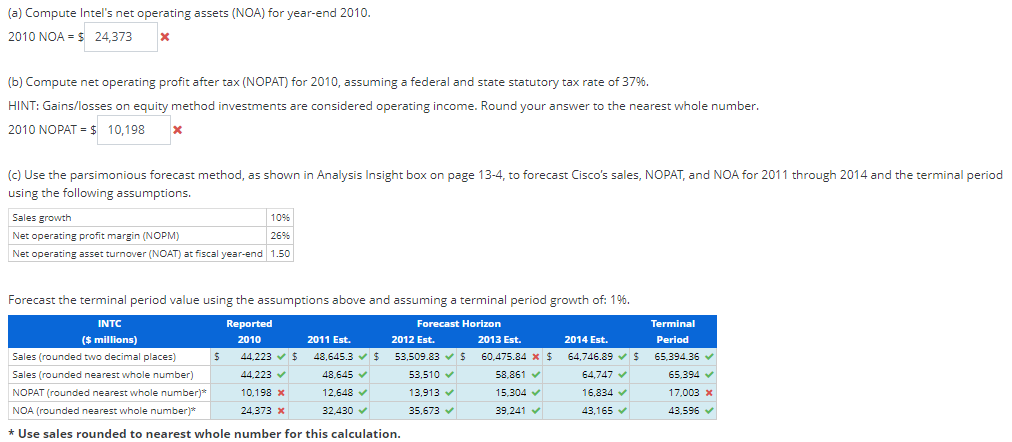
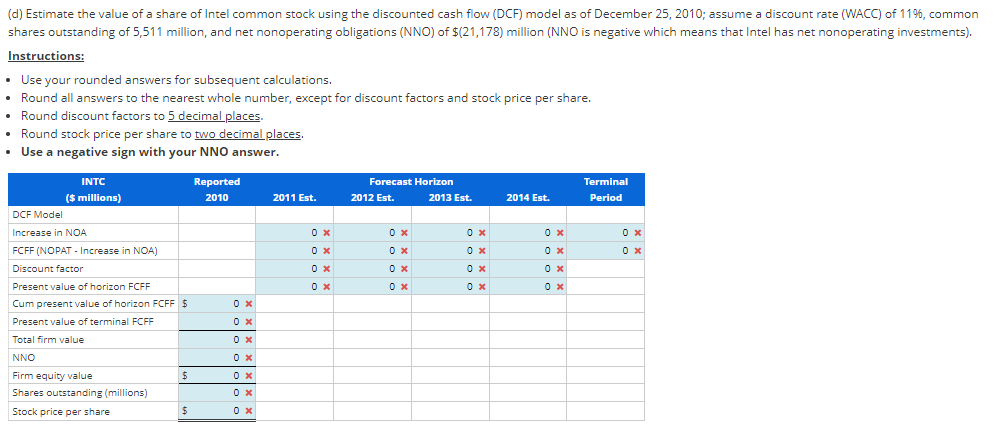
Forecasting and Estimating Share Value Using the DCF Model Following are the income statement and balance sheet for Intel Corporation. INTEL CORPORATION Consolidated Statements of Income Year Ended (In millions) Dec. 25, 2010 Dec. 26, 2009 Dec. 27, 2008 Net revenue $ 44.223 $ 35,127 $37.586 Cost of sales 15.132 15.566 16.742 Gross margin 29.091 19.561 20.844 Research and development 6.576 5.653 5.722 Marketing, general and administrative 6.309 7.931 5,452 Restructuring and asset impairment charges 231 710 Amortization of acquisition-related intangibles 18 35 6 Operating expenses 12.903 13.850 11.890 Operating income 16,188 5,711 8.954 Gains (losses) on equity method investments, net* 117 (147) (1.380) Gains (losses) on other equity investments, net 231 (23) (376) Interest and other, net 109 163 488 Income before taxes 16,645 5,704 7.686 Provisions for taxes 4.581 1.335 2.394 Net income $ 12,064 $4.369 $5.292 -- UD *This should be considered as operating income. Dec. 25, 2010 Dec. 26, 2009 $5,498 11.294 $ 3.987 5,285 4.648 2.273 5,093 2.667 3.757 2.935 1.216 1.888 1,614 31.811 17.899 813 21,157 17.225 1.008 3.026 773 4.179 4.531 4,421 5.111 5.340 $63.386 $53,095 INTEL CORPORATION Consolidated Balance Sheets As of Year-Ended (In millions, except par value) Assets Current assets Cash and cash equivalents Short-term investments Trading assets Accounts receivables, net Inventories Deferred tax assets Other current assets Total current assets Property, plant and equipment, net Marketable equity securities Other long-term investments** Goodwill Other long-term assets Total assets Liabilities Current liabilities Short-term debt Accounts payable Accrued compensation and benefits Accrued advertising Deferred income on shipments to distributors Other accrued liabilities Total current liabilities Long-term income taxes payable Long-term debt Long-term deferred tax liabilities Other long-term liabilities Total liabilities Stockholders' equity: Preferred stock. $0.001 par value Common stock, $0.001 par value. 10,000 shares authorized: 5,581 issued and 5,511 outstanding and capital in excess of par value Accumulated other comprehensive income (loss) Retained earnings Total stockholders' equity Total liabilities and stockholders' equity ** These investments are operating assets as they relate to associated companies. $38 $172 1,883 2.448 2.190 2.888 1,007 622 773 593 2,482 1.722 9,227 190 7.591 193 2.049 1,677 926 555 1.236 1,003 11,391 13.256 14.993 16,178 333 393 33.619 26,318 50.130 41,704 $63.386 $ 53,095 (a) Compute Intel's net operating assets (NOA) for year-end 2010. 2010 NOA = $ 24,373 X (b) Compute net operating profit after tax (NOPAT) for 2010, assuming a federal and state statutory tax rate of 37%. HINT: Gains/losses on equity method investments are considered operating income. Round your answer to the nearest whole number. 2010 NOPAT = $ 10,198 x (c) Use the parsimonious forecast method, as shown in Analysis Insight box on page 13-4, to forecast Cisco's sales, NOPAT, and NOA for 2011 through 2014 and the terminal period using the following assumptions. Sales growth 1096 Net operating profit margin (NOPM) 26% Net operating asset turnover (NOAT) at fiscal year-end 1.50 Forecast the terminal period value using the assumptions above and assuming a terminal period growth of: 19. INTC Reported Forecast Horizon ($ millions) ( 2010 2011 Est. 2012 Est. 2013 Est. 2014 Est. Sales (rounded two decimal places) $ $ 44.223$ 48,645.3 $ 53,509.839 60,475.84 x $ 64,746.89 $ Sales (rounded nearest whole number) 44.223 48,645 53.510 58,861 64,747 NOPAT (rounded nearest whole number)* 10.198 x 12.648 13.913 15,304 16,834 NOA (rounded nearest whole number)* 24.373 X 32.430 35,673 39,241 43,165 Terminal Period 65,394 36 65.394 17.003 x 43.596 * Use sales rounded to nearest whole number for this calculation. (d) Estimate the value of a share of Intel common stock using the discounted cash flow (DCF) model as of December 25, 2010; assume a discount rate (WACC) of 1196, common shares outstanding of 5,511 million, and net nonoperating obligations (NNO) of $(21,178) million (NNO is negative which means that Intel has net nonoperating investments). Instructions: Use your rounded answers for subsequent calculations. Round all answers to the nearest whole number, except for discount factors and stock price per share. Round discount factors to 5 decimal places. Round stock price per share to two decimal places Use a negative sign with your NNO answer. INTC Reported Forecast Horizon Terminal ($ millions) 2010 2011 Est. 2012 Est. 2013 Est. 2014 Est. Period DCF Model Increase in NOA OX OX OX 0 x FCFF (NOPAT - Increase in NOA) OX OX OX OX Discount factor OX OX Present value of horizon FCFF OX Ox OX OX Cum present value of horizon FCFF $ Present value of terminal FCFF Total firm value NNO OX Firm equity value $ OX Shares outstanding (millions) OX Stock price per share $ OX 0 X 0 X 0 x Forecasting and Estimating Share Value Using the DCF Model Following are the income statement and balance sheet for Intel Corporation. INTEL CORPORATION Consolidated Statements of Income Year Ended (In millions) Dec. 25, 2010 Dec. 26, 2009 Dec. 27, 2008 Net revenue $ 44.223 $ 35,127 $37.586 Cost of sales 15.132 15.566 16.742 Gross margin 29.091 19.561 20.844 Research and development 6.576 5.653 5.722 Marketing, general and administrative 6.309 7.931 5,452 Restructuring and asset impairment charges 231 710 Amortization of acquisition-related intangibles 18 35 6 Operating expenses 12.903 13.850 11.890 Operating income 16,188 5,711 8.954 Gains (losses) on equity method investments, net* 117 (147) (1.380) Gains (losses) on other equity investments, net 231 (23) (376) Interest and other, net 109 163 488 Income before taxes 16,645 5,704 7.686 Provisions for taxes 4.581 1.335 2.394 Net income $ 12,064 $4.369 $5.292 -- UD *This should be considered as operating income. Dec. 25, 2010 Dec. 26, 2009 $5,498 11.294 $ 3.987 5,285 4.648 2.273 5,093 2.667 3.757 2.935 1.216 1.888 1,614 31.811 17.899 813 21,157 17.225 1.008 3.026 773 4.179 4.531 4,421 5.111 5.340 $63.386 $53,095 INTEL CORPORATION Consolidated Balance Sheets As of Year-Ended (In millions, except par value) Assets Current assets Cash and cash equivalents Short-term investments Trading assets Accounts receivables, net Inventories Deferred tax assets Other current assets Total current assets Property, plant and equipment, net Marketable equity securities Other long-term investments** Goodwill Other long-term assets Total assets Liabilities Current liabilities Short-term debt Accounts payable Accrued compensation and benefits Accrued advertising Deferred income on shipments to distributors Other accrued liabilities Total current liabilities Long-term income taxes payable Long-term debt Long-term deferred tax liabilities Other long-term liabilities Total liabilities Stockholders' equity: Preferred stock. $0.001 par value Common stock, $0.001 par value. 10,000 shares authorized: 5,581 issued and 5,511 outstanding and capital in excess of par value Accumulated other comprehensive income (loss) Retained earnings Total stockholders' equity Total liabilities and stockholders' equity ** These investments are operating assets as they relate to associated companies. $38 $172 1,883 2.448 2.190 2.888 1,007 622 773 593 2,482 1.722 9,227 190 7.591 193 2.049 1,677 926 555 1.236 1,003 11,391 13.256 14.993 16,178 333 393 33.619 26,318 50.130 41,704 $63.386 $ 53,095 (a) Compute Intel's net operating assets (NOA) for year-end 2010. 2010 NOA = $ 24,373 X (b) Compute net operating profit after tax (NOPAT) for 2010, assuming a federal and state statutory tax rate of 37%. HINT: Gains/losses on equity method investments are considered operating income. Round your answer to the nearest whole number. 2010 NOPAT = $ 10,198 x (c) Use the parsimonious forecast method, as shown in Analysis Insight box on page 13-4, to forecast Cisco's sales, NOPAT, and NOA for 2011 through 2014 and the terminal period using the following assumptions. Sales growth 1096 Net operating profit margin (NOPM) 26% Net operating asset turnover (NOAT) at fiscal year-end 1.50 Forecast the terminal period value using the assumptions above and assuming a terminal period growth of: 19. INTC Reported Forecast Horizon ($ millions) ( 2010 2011 Est. 2012 Est. 2013 Est. 2014 Est. Sales (rounded two decimal places) $ $ 44.223$ 48,645.3 $ 53,509.839 60,475.84 x $ 64,746.89 $ Sales (rounded nearest whole number) 44.223 48,645 53.510 58,861 64,747 NOPAT (rounded nearest whole number)* 10.198 x 12.648 13.913 15,304 16,834 NOA (rounded nearest whole number)* 24.373 X 32.430 35,673 39,241 43,165 Terminal Period 65,394 36 65.394 17.003 x 43.596 * Use sales rounded to nearest whole number for this calculation. (d) Estimate the value of a share of Intel common stock using the discounted cash flow (DCF) model as of December 25, 2010; assume a discount rate (WACC) of 1196, common shares outstanding of 5,511 million, and net nonoperating obligations (NNO) of $(21,178) million (NNO is negative which means that Intel has net nonoperating investments). Instructions: Use your rounded answers for subsequent calculations. Round all answers to the nearest whole number, except for discount factors and stock price per share. Round discount factors to 5 decimal places. Round stock price per share to two decimal places Use a negative sign with your NNO answer. INTC Reported Forecast Horizon Terminal ($ millions) 2010 2011 Est. 2012 Est. 2013 Est. 2014 Est. Period DCF Model Increase in NOA OX OX OX 0 x FCFF (NOPAT - Increase in NOA) OX OX OX OX Discount factor OX OX Present value of horizon FCFF OX Ox OX OX Cum present value of horizon FCFF $ Present value of terminal FCFF Total firm value NNO OX Firm equity value $ OX Shares outstanding (millions) OX Stock price per share $ OX 0 X 0 X 0 x
Step by Step Solution
There are 3 Steps involved in it

Get step-by-step solutions from verified subject matter experts