

Question: Forecasting Methods Unlike the method in the lecture, in the methods below you will find different estimation methods that do not take into account the
Forecasting Methods
Unlike the method in the lecture, in the methods below you will find different estimation methods that do not take into account the stochasticity in demand forecasting. The tables in the Case article Canyon Bicycles.pdf will also help you in your solutions.
What would be the demand forecast, total demand forecast and net profit for each cycling model using the Judgmental Forecasting method?
Note: You can find the demand forecasts of the experts for in Table in the article FC in the table shows the demand forecast of Mr Arnold, the CEO of the company demand forecasts and realisations are given in Table
If the average of the demand forecasts of the whole group was used as the forecast for the next year Means Average Forecasting what would be the demand forecast and total demand forecast and net profit for each cycling model?
The average growth rate of the company for the last years is What would be the demand forecast, total demand forecast and net profit for each cycling model when demand forecasting is done with Means Average Forecasting Growth Rate approach?
What would be the demand forecasts and net profit if the growth rate of which is was used as the growth rate in Question
The proportions of the models in the total demand in are given in the table below. What would be the total demand, the demand forecast for each bicycle model and the net profit if the total demand forecast was made for each bicycle model considering the ratios of the previous year, using a TopDown approach for demand forecasting? You can use your forecast in Question as the total demand forecast for
Grand Canyon
Nerve
Yellowstone
Strive
Speedmax
Roadlite
Ultimate
Endurance
What would be the demand forecast, total demand forecast and net profit for each cycling model if demand forecasting was performed with the Adjusted Mean Forecasting L demand approach using the AF ratio of the group's average demand at LevelNote: AF ratio at Level
What would be the demand forecast, total demand forecast and net profit for each cycling model if demand forecasting was performed with the Adjusted Mean Forecasting L demand approach using the AF ratios of the average demand of the group at LevelNote: AF ratio at Level MTB and RB
What would be the demand forecast, total demand forecast and net profit for each cycling model if the group's average demand was forecasted with the Adjusted Mean Forecasting L demand approach using the AF ratios at LevelNote: AF ratios at Level MTBAL MTBCF RBAL and RBCF
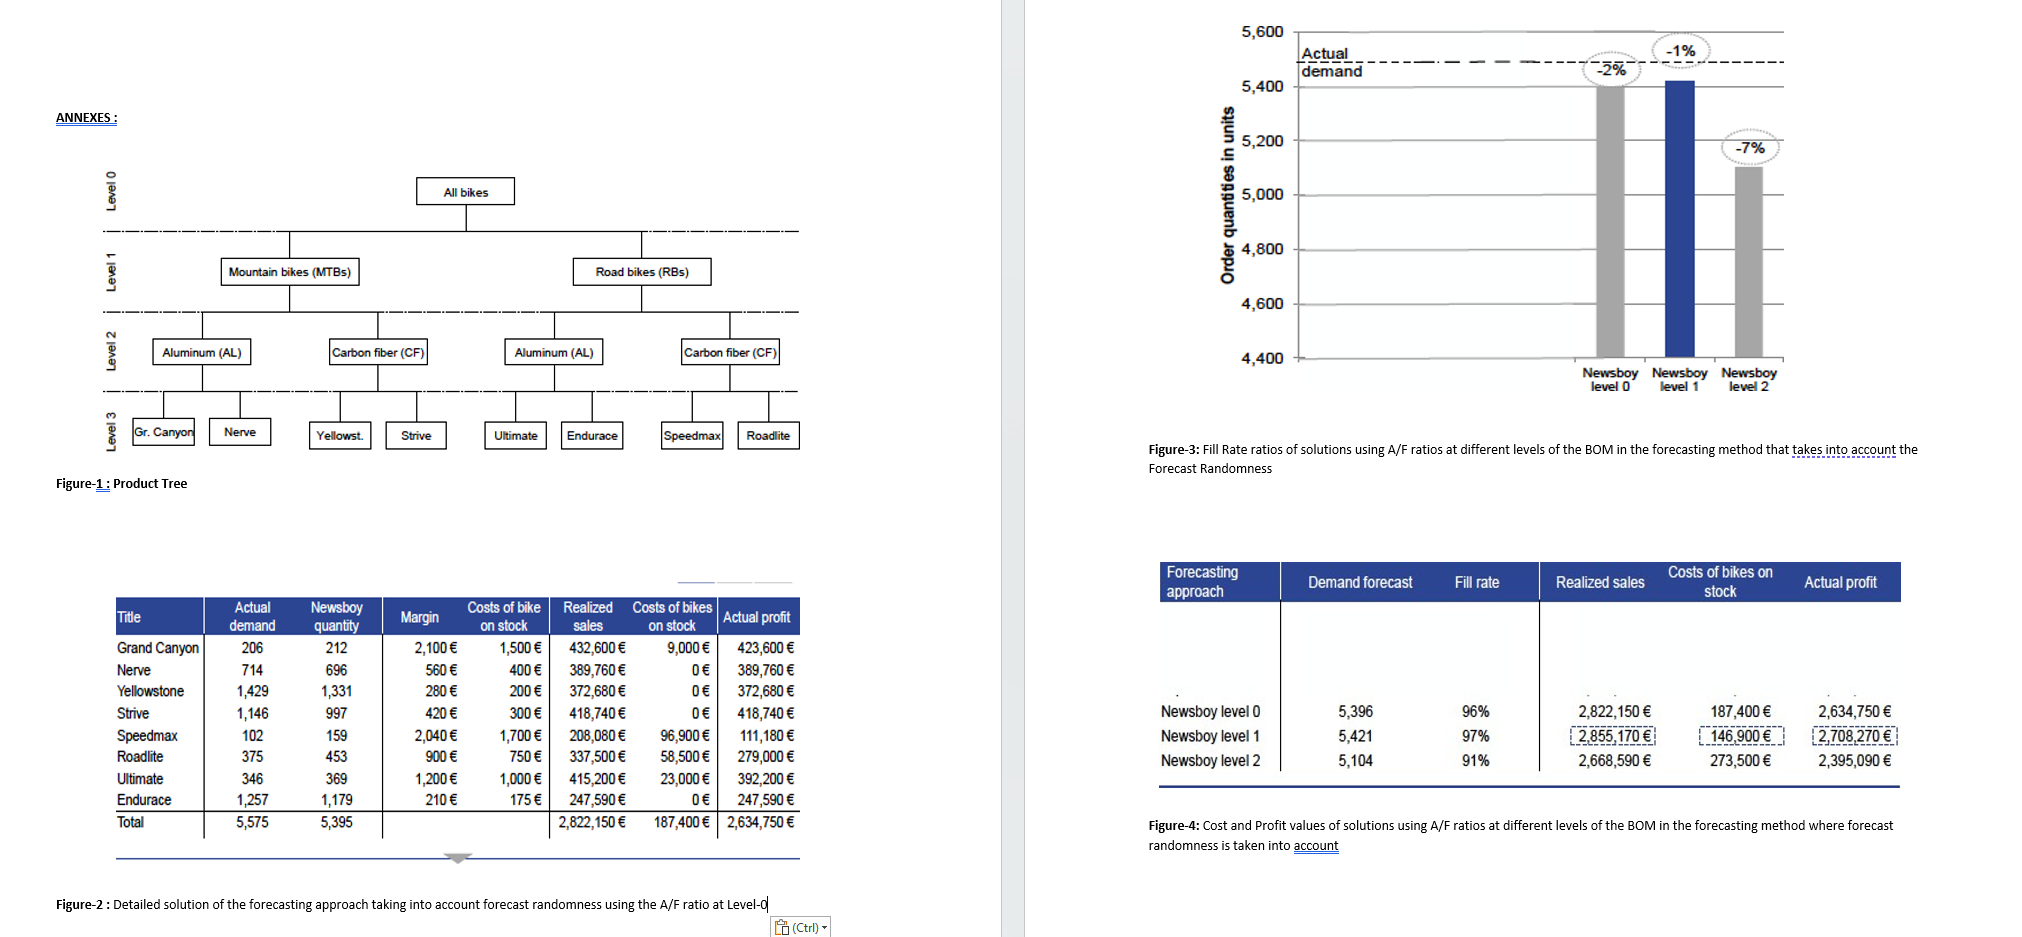
You can find the tables and results of the methods that take into account the stochasticity of the forecasts proposed in the Case in the APPENDICES. Figure gives the details of the calculations made in the class using the AF ratio at Level while Figure and Figure give the summary results of all the approaches we have made in the class that take into account the stochasticity If you compare the results of the methods you used above with the methods that take into account the randomness proposed in Case based on realisations, you can see that the methods
consider total demand, realised demand, stockout cost and net profit
Note: When we forecast demand with the above methods, our order quantity for production will be equal to our demand forecast. Since we do not use the "Newsboy Model" as in the method we discussed in class since we do not consider randomness in the forecast the order quantity is equal to the demand forecast.Figure: Fill Rate ratios of solutions using AF ratios at different levels of the BOM in the forecasting method that takes into account the
Forecast Randomness
Figure: Cost and Profit values of solutions using AF ratios at different levels of the BOM in the forecasting method where forecast
randomness is taken into account
Step by Step Solution
There are 3 Steps involved in it
1 Expert Approved Answer
Step: 1 Unlock

Question Has Been Solved by an Expert!
Get step-by-step solutions from verified subject matter experts
Step: 2 Unlock
Step: 3 Unlock