

Question: Forecasting using simple methods (29 pts.) The Daily worksheet shows the Call Volume (number of requests received) for every day in 2018 and 2019 (that
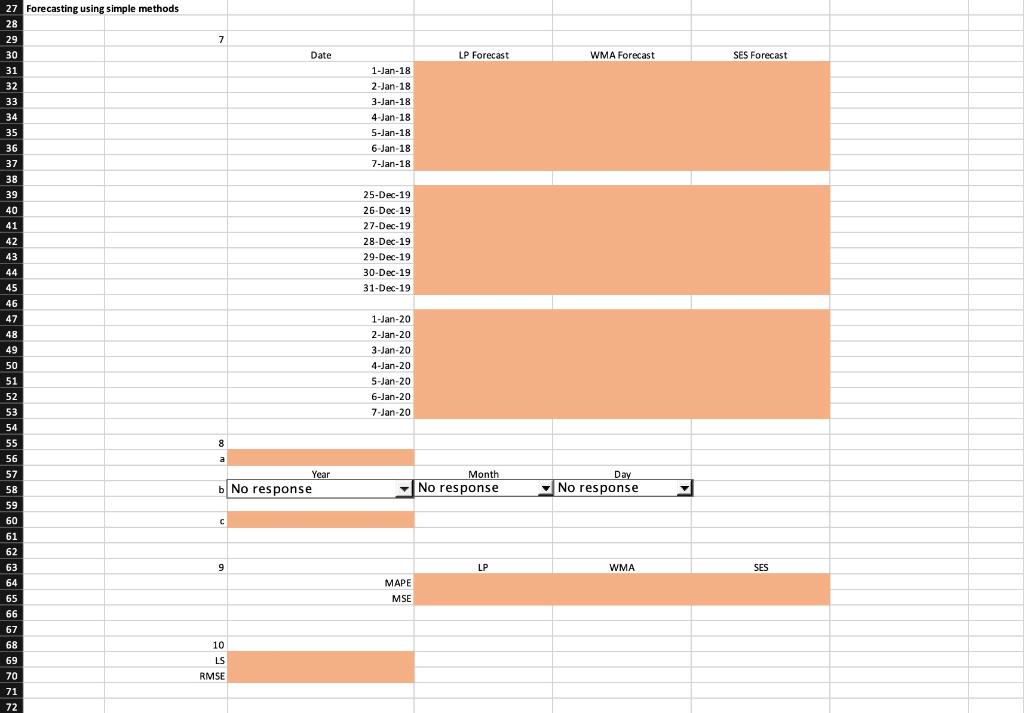

Forecasting using simple methods (29 pts.) The "Daily" worksheet shows the Call Volume (number of requests received) for every day in 2018 and 2019 (that is, from 1 January 2018 to 31 December 2019). Use this data to answer the remaining questions, in which we will guide you through some steps in forecasting Call Volume using simple time series forecasting methods. Vote 2: It will be easier to answer Questions 8,9 , and 10 if you think carefully about how to organize the calculations. One possibility is to have one worksheet for each forecasting method (LP, WMA, SES) with all of the calculations (forecasts, errors, absolute errors, etc.) for that forecasting method. 7. (18 pts.) Use the following methods to compute forecasts for the Number of Calls: - LP= Last Point method - WMA-4 = Weighted Moving Average with weights 0.1,0.2,0.3, and 0.4(0.1 for the oldest data point in the window) - SES = Simple Exponential Smoothing, with LS=0.55 Report forecasts of all methods only for the first seven days of 2018, the last seven days of 2019, and the first seven days of 2020 . Leave answer cells blank for forecasts that cannot be computed. 8. (3 pts.) Compute errors (i.e. data minus forecast), absolute errors, and absolute percent errors for all of the methods from Question 7 and for every day for which you have both data and a forecast. Report the following: a) The largest error (largest positive value) of the LP method b) The date on which the absolute error is the largest for the WMA method c) The largest absolute error of the SES method 9. (6 pts.) Compute MAPE and MSE for all methods in Question 7, for the last seven days of 2019. Comment on Question 9: It is important to be able to compute performance measures for different time ntervals. Sometimes we want to compute a performance measure for separate time intervals for a single forecasting method to see whether the forecast accuracy is changing over time. Other times we Nant to compute a performance measure for a single time interval for multiple forecasting methods, to see which method would have been most accurate, for that time interval. 10. (3 pts.) (Feasibility 1 pt., consistency 1 pt., optimality 1 pt.) For the SES method, use Solver to find the LS value that minimizes RMSE for all periods that we have both data and forecast. Keep LS in the range 0.01 to 0.99. Report also the RMSE using the best value of LS that you found. 27 Forecasting using simple methods c. 9 \begin{tabular}{r|r|c|c} \hline LP & WMA & SES \\ \hline MAPE & & & \\ \hline MSE & & \end{tabular} 10 LS RMSE
Step by Step Solution
There are 3 Steps involved in it

Get step-by-step solutions from verified subject matter experts