

Question: Forecasting with the Parsimonious Method and Estimating Share Value Using the DCF Model Following are the income statement and balance sheet for Cisco Systems for
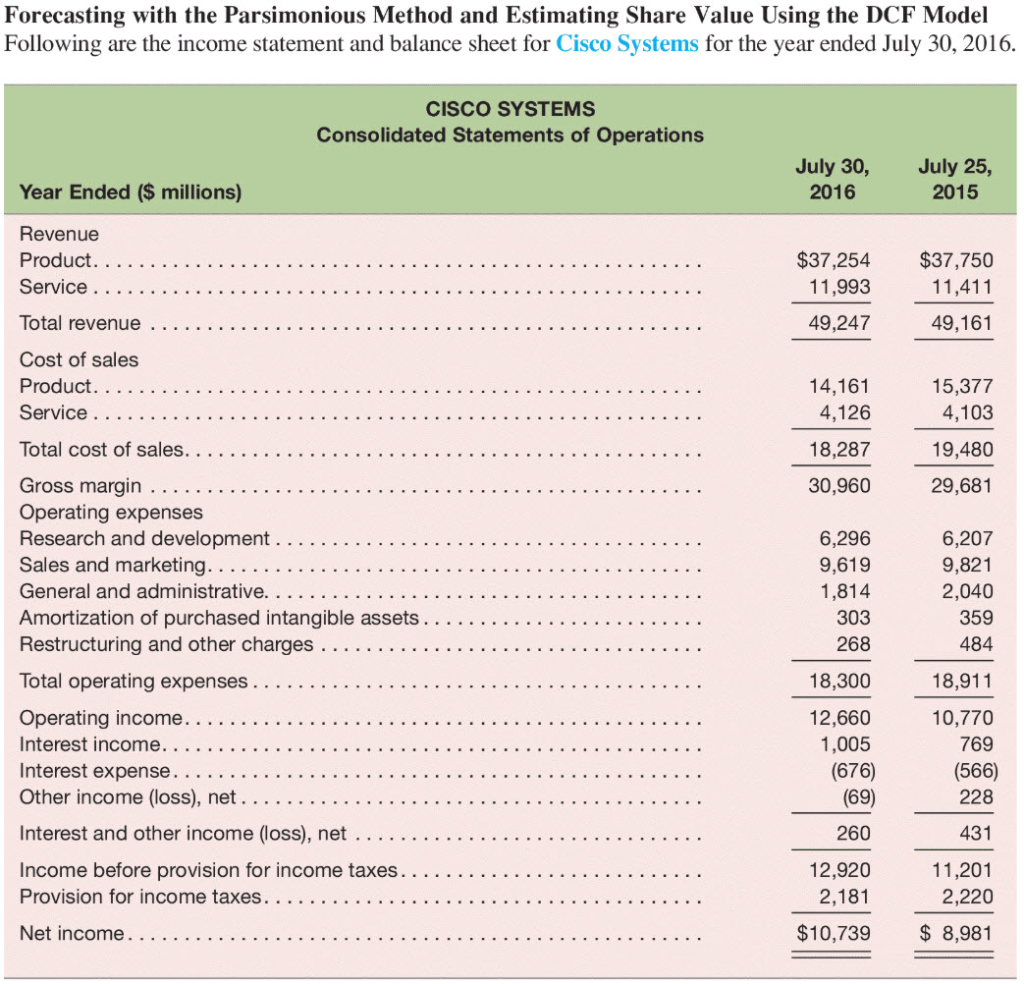
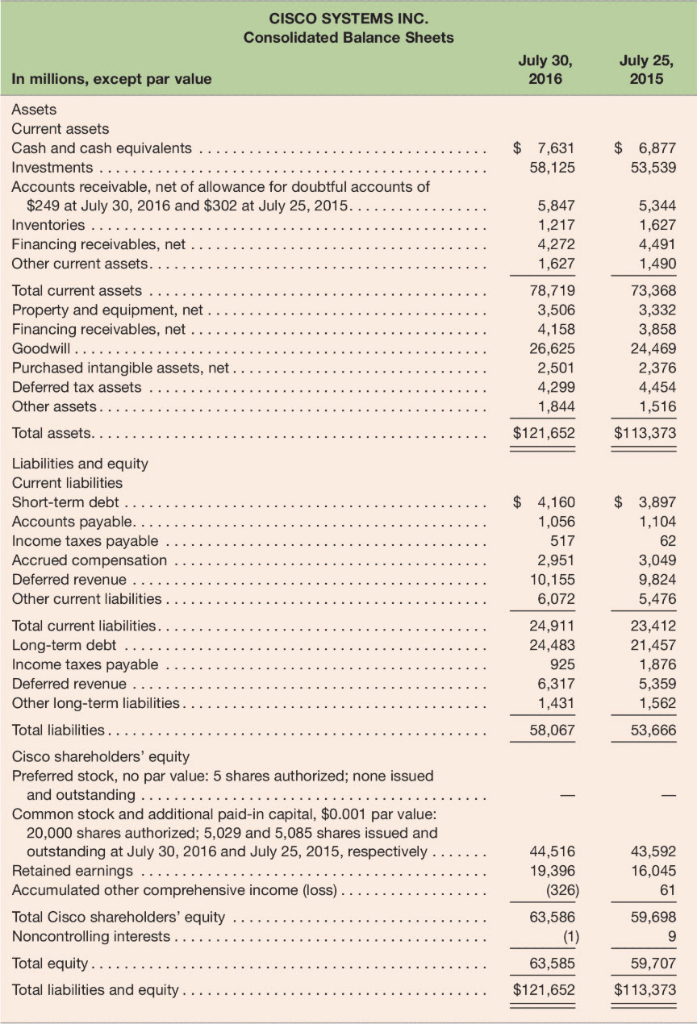
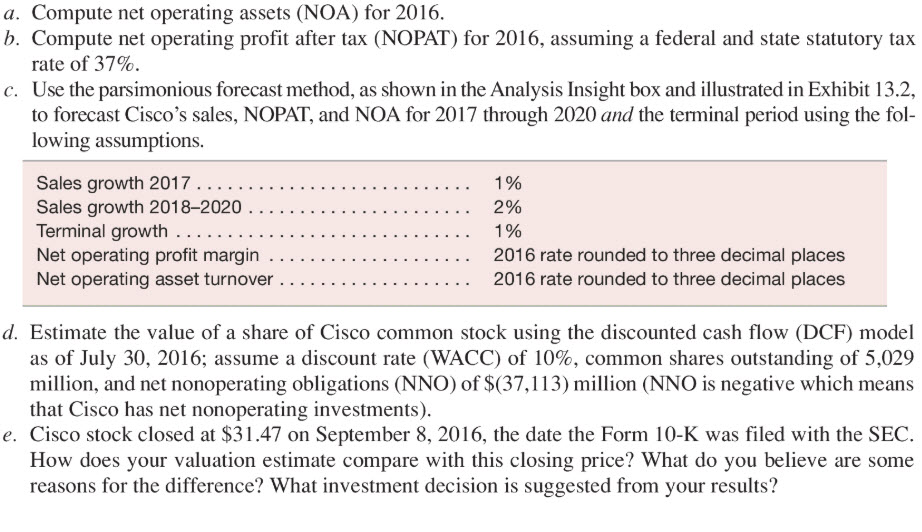
Forecasting with the Parsimonious Method and Estimating Share Value Using the DCF Model Following are the income statement and balance sheet for Cisco Systems for the year ended July 30, 2016. CISCO SYSTEMS Consolidated Statements of Operations July 30, 2016 July 25, 2015 Year Ended (S millions) Revenue $37,254 $37,750 11,411 49,161 11,993 49,247 Cost of sales 14,161 4,126 18,287 30,960 15,377 4,103 19,480 29,681 Operating expenses 6,296 9,619 1,814 303 268 18,300 12,660 1,005 (676) (69) 260 12,920 2,181 6,207 9,821 2,040 359 484 18,911 10,770 769 (566) 228 431 Restructuring and other charges . . . . . . . . . . . . . . . . . . . . . . . . . . . . . . . . . . Interest and other income (loss), net . . . . . . . . before provision for income taxes. . . . _ _ . . . . . . . . . . . . . . . . . . . . . Income 11,201 2,220 . . . . . . . _ . . . . . . . . . . . . . . . $10,739 8,981 CISCO SYSTEMS INC Consolidated Balance Sheets July 30, 2016 2015 In millions, except par value Assets Current assets 58,125 53,539 Accounts receivable, net of allowance for doubtful accounts of 5,847 1,217 4,272 1,627 78,719 3,506 5,344 1,627 4,491 1,490 73,368 3,332 3,858 24,469 2,376 4,454 1,516 26,625 2,501 4,299 1,844 Liabilities and equity Current liabilities 1,104 62 3,049 9,824 5,476 23,412 21,457 1,876 5,359 1,562 53,666 517 10,155 6,072 24,911 24,483 925 6,317 1,431 58,067 Cisco shareholders' equity Preferred stock, no par value: 5 shares authorized; none issued Common stock and additional paid-in capital, $0.001 par value 20,000 shares authorized; 5,029 and 5,085 shares issued and outstanding at July 30, 2016 and July 25, 2015, respectively . . . . ..44,516 43,592 16,045 61 19,396 (326) 63,586 Accumulated other comprehensive income (loss). . . . . . . . . . . . . . . . . . 59,698 63,585 59,707 Total liabilities and equity . . . . . . .. . . . . . . . . . . . . . . . . . .$121,652 $113,373 a. Compute net operating assets (NOA) for 2016. b. Compute net operating profit after tax (NOPAT) for 2016, assuming a federal and state statutory tax rate of 37%. Use the parsimonious forecast method, as shown in the Analysis Insight box and illustrated in Exhibit 13.2, to forecast Cisco's sales, NOPAT, and NOA for 2017 through 2020 and the terminal period using the fol- lowing assumptions. c. Sales growth 2017 Sales growth 2018-2020 Terminal growth Net operating profit margin . . . . . . . . . . . . . . .. . . .. Net operating asset turnover . . . . . . . . . . . . . .. . . .. 1% 290 1% 2016 rate rounded to three decimal places 2016 rate rounded to three decimal places d. Estimate the value of a share of Cisco common stock using the discounted cash flow (DCF) model as of July 30, 2016; assume a discount rate (WACC) of 10%, common shares outstanding of 5,029 million, and net nonoperating obligations (NNO) of S(37,113) milion (NNO is negative which means that Cisco has net nonoperating investments). e. Cisco stock closed at $31.47 on September 8, 2016, the date the Form 10-K was filed with the SEC How does your valuation estimate compare with this closing price? What do you believe are some reasons for the difference? What investment decision is suggested from your results? Forecasting with the Parsimonious Method and Estimating Share Value Using the DCF Model Following are the income statement and balance sheet for Cisco Systems for the year ended July 30, 2016. CISCO SYSTEMS Consolidated Statements of Operations July 30, 2016 July 25, 2015 Year Ended (S millions) Revenue $37,254 $37,750 11,411 49,161 11,993 49,247 Cost of sales 14,161 4,126 18,287 30,960 15,377 4,103 19,480 29,681 Operating expenses 6,296 9,619 1,814 303 268 18,300 12,660 1,005 (676) (69) 260 12,920 2,181 6,207 9,821 2,040 359 484 18,911 10,770 769 (566) 228 431 Restructuring and other charges . . . . . . . . . . . . . . . . . . . . . . . . . . . . . . . . . . Interest and other income (loss), net . . . . . . . . before provision for income taxes. . . . _ _ . . . . . . . . . . . . . . . . . . . . . Income 11,201 2,220 . . . . . . . _ . . . . . . . . . . . . . . . $10,739 8,981 CISCO SYSTEMS INC Consolidated Balance Sheets July 30, 2016 2015 In millions, except par value Assets Current assets 58,125 53,539 Accounts receivable, net of allowance for doubtful accounts of 5,847 1,217 4,272 1,627 78,719 3,506 5,344 1,627 4,491 1,490 73,368 3,332 3,858 24,469 2,376 4,454 1,516 26,625 2,501 4,299 1,844 Liabilities and equity Current liabilities 1,104 62 3,049 9,824 5,476 23,412 21,457 1,876 5,359 1,562 53,666 517 10,155 6,072 24,911 24,483 925 6,317 1,431 58,067 Cisco shareholders' equity Preferred stock, no par value: 5 shares authorized; none issued Common stock and additional paid-in capital, $0.001 par value 20,000 shares authorized; 5,029 and 5,085 shares issued and outstanding at July 30, 2016 and July 25, 2015, respectively . . . . ..44,516 43,592 16,045 61 19,396 (326) 63,586 Accumulated other comprehensive income (loss). . . . . . . . . . . . . . . . . . 59,698 63,585 59,707 Total liabilities and equity . . . . . . .. . . . . . . . . . . . . . . . . . .$121,652 $113,373 a. Compute net operating assets (NOA) for 2016. b. Compute net operating profit after tax (NOPAT) for 2016, assuming a federal and state statutory tax rate of 37%. Use the parsimonious forecast method, as shown in the Analysis Insight box and illustrated in Exhibit 13.2, to forecast Cisco's sales, NOPAT, and NOA for 2017 through 2020 and the terminal period using the fol- lowing assumptions. c. Sales growth 2017 Sales growth 2018-2020 Terminal growth Net operating profit margin . . . . . . . . . . . . . . .. . . .. Net operating asset turnover . . . . . . . . . . . . . .. . . .. 1% 290 1% 2016 rate rounded to three decimal places 2016 rate rounded to three decimal places d. Estimate the value of a share of Cisco common stock using the discounted cash flow (DCF) model as of July 30, 2016; assume a discount rate (WACC) of 10%, common shares outstanding of 5,029 million, and net nonoperating obligations (NNO) of S(37,113) milion (NNO is negative which means that Cisco has net nonoperating investments). e. Cisco stock closed at $31.47 on September 8, 2016, the date the Form 10-K was filed with the SEC How does your valuation estimate compare with this closing price? What do you believe are some reasons for the difference? What investment decision is suggested from your results
Step by Step Solution
There are 3 Steps involved in it

Get step-by-step solutions from verified subject matter experts