Question: Forecasting with the Parsimonious Method and Estimating Share Value Using the ROPI Model Following are income statements and balance sheets for Cisco Systems. Note: Complete
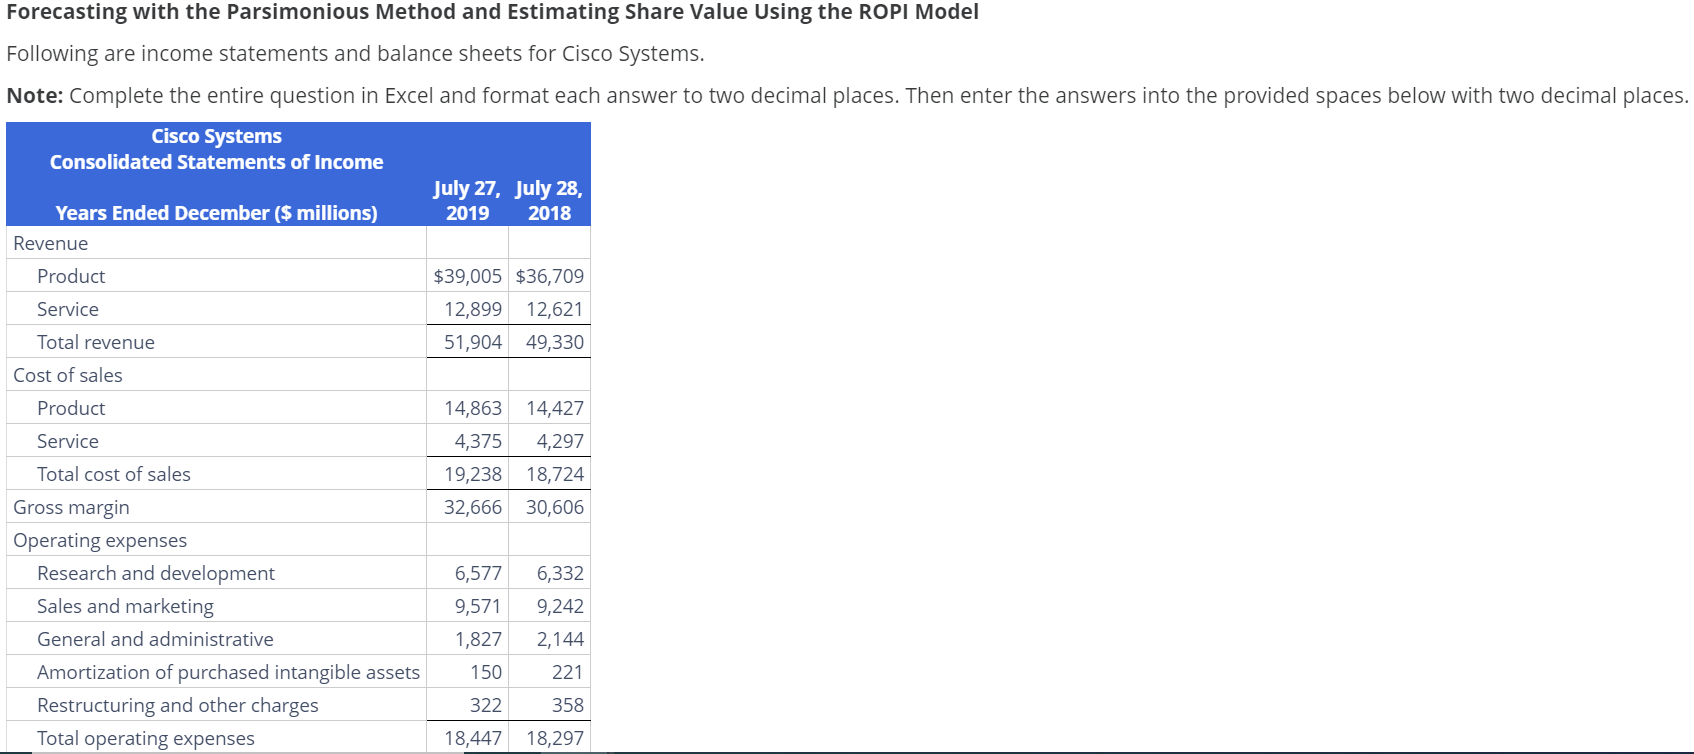
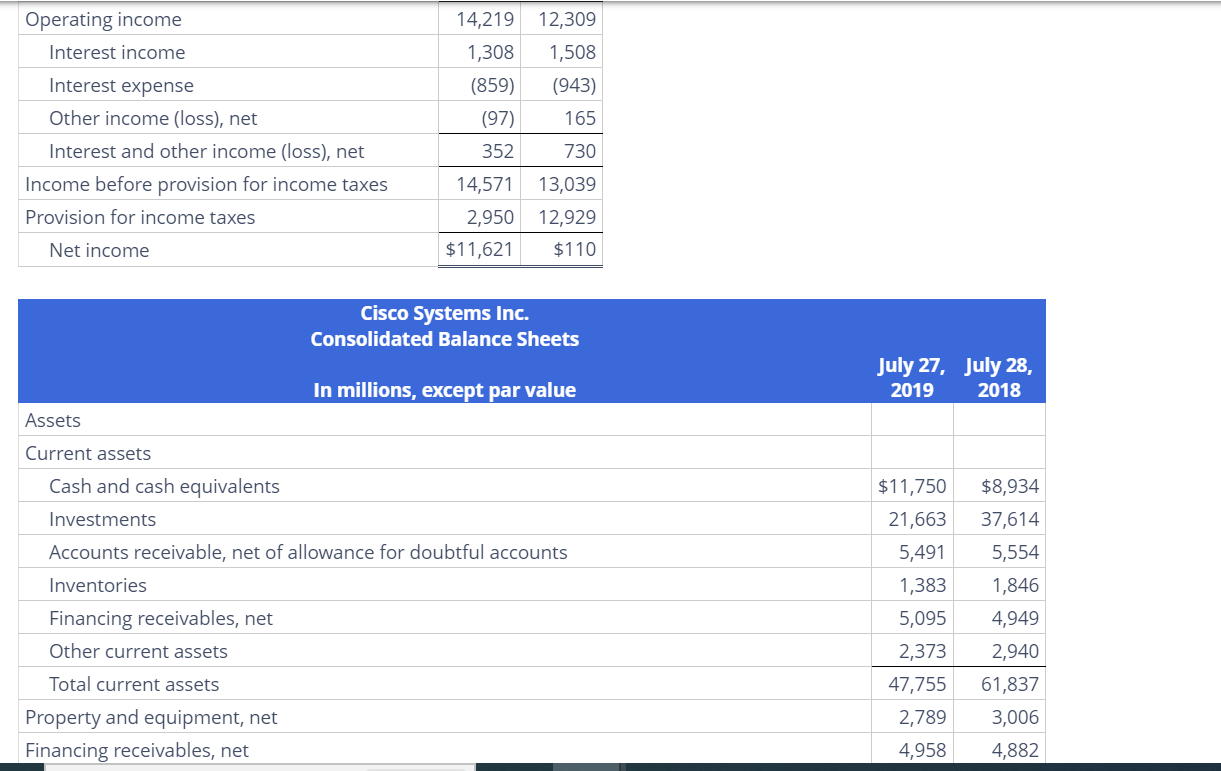
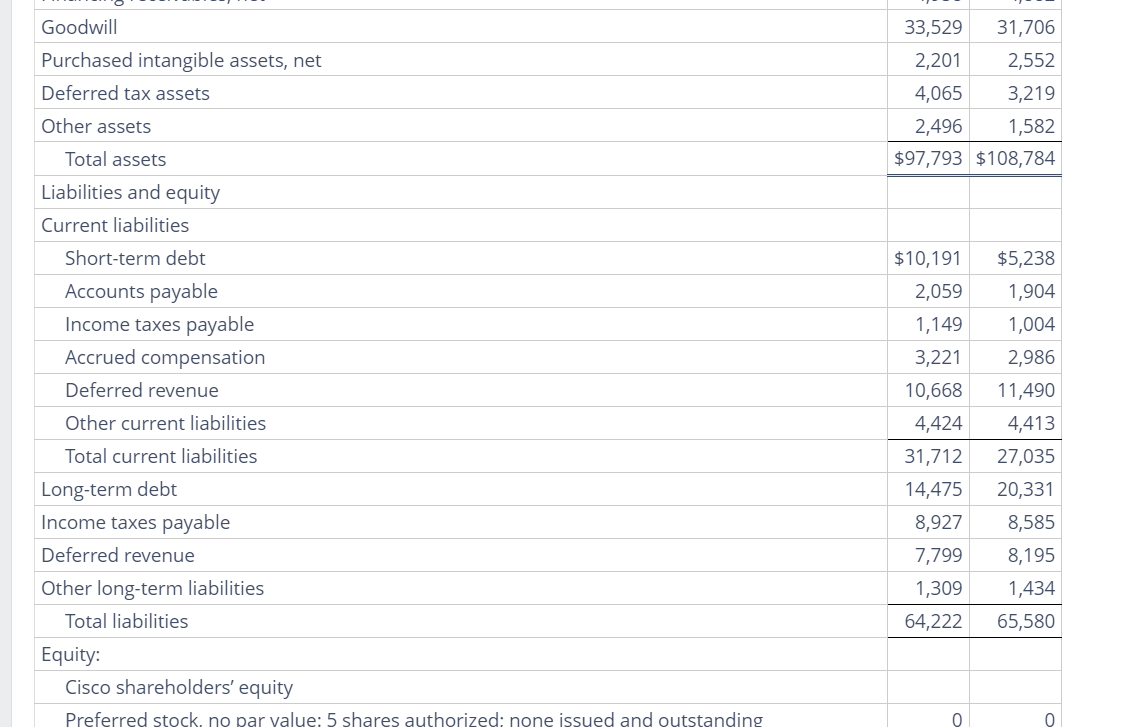
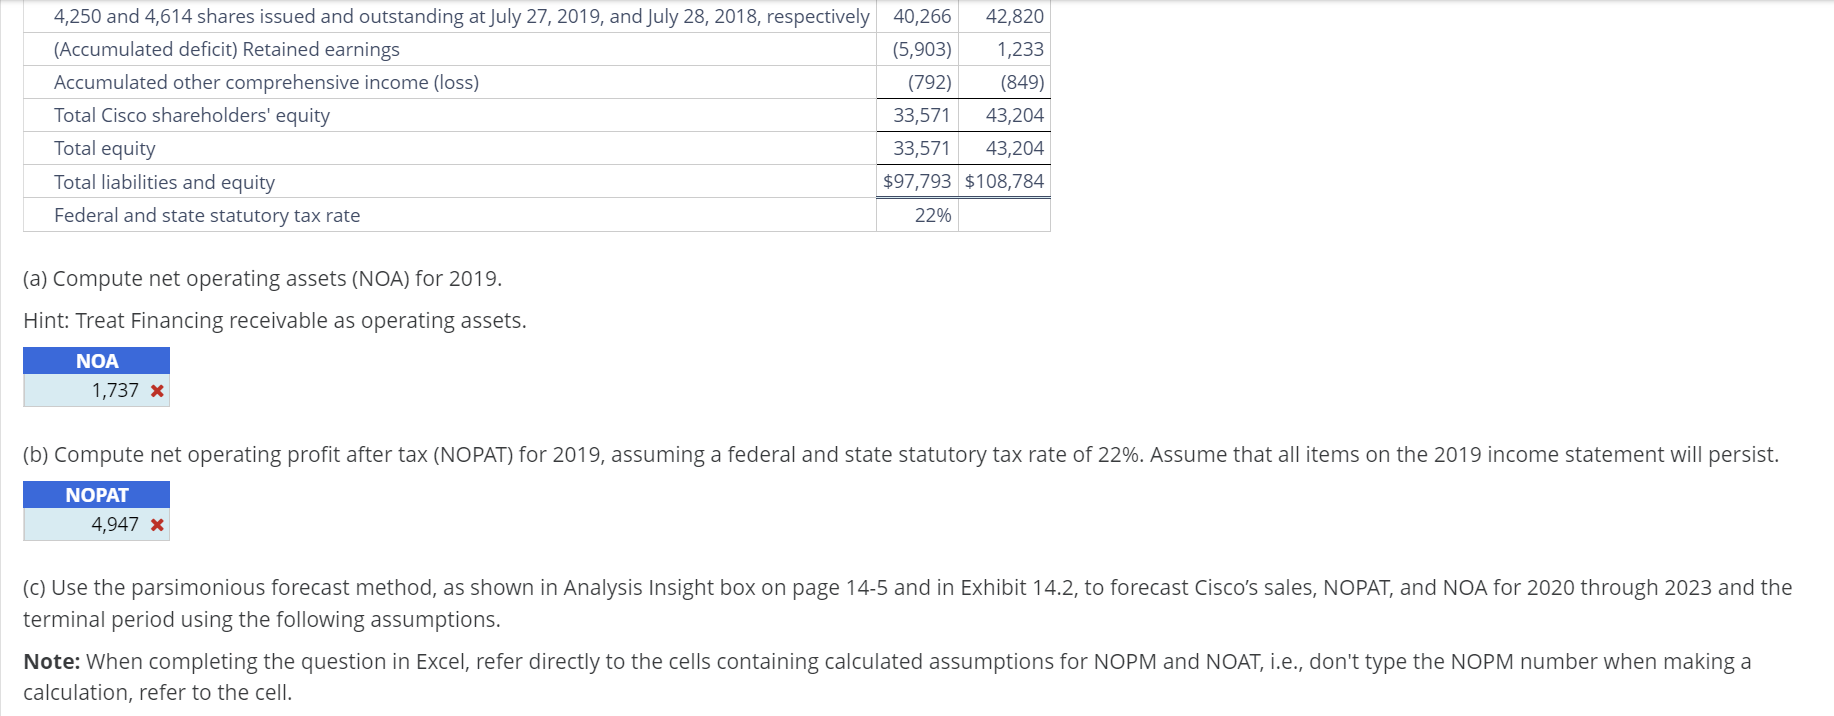
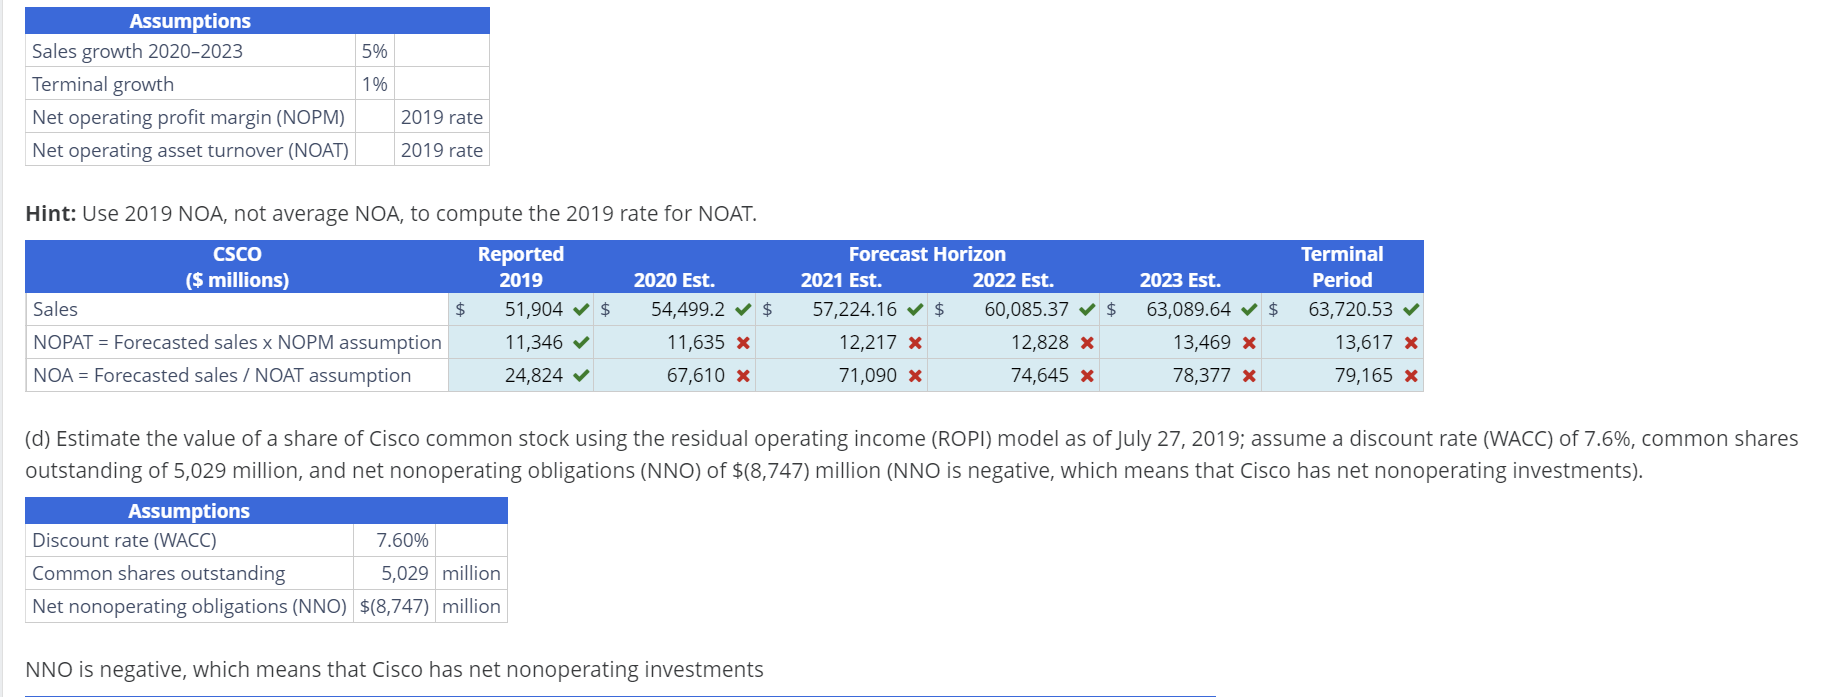
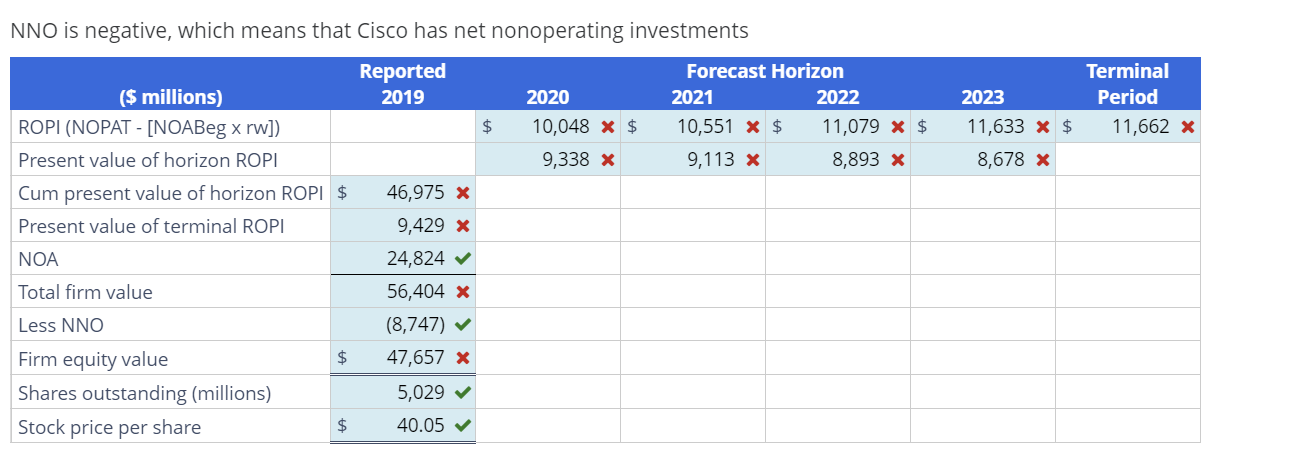
Forecasting with the Parsimonious Method and Estimating Share Value Using the ROPI Model Following are income statements and balance sheets for Cisco Systems. Note: Complete the entire question in Excel and format each answer to two decimal places. Then enter the answers into the provided spaces below with two decimal places. Cisco Systems Consolidated Statements of Income Years Ended December ($ millions) Revenue Product $39,005 $36,709 Service 12,809 12,621 Total revenue 51,904 49,330 Cost of sales Product 14,863 14,427 Service 4,375 4,297 Total cost of sales 19,238 18,724 Gross margin 32,666 30,606 Operating expenses Research and development 6,577 6,332 Sales and marketing 9,571 9,242 General and administrative 1,827 2,144 Amortization of purchased intangible assets 150 221 Restructuring and other charges 322 358 Total operating expenses 18,447 18,297 Operating income 14,219 12,309 Interest income 1,308 1,508 Interest expense (859) (943) Other income (loss), net (97) 165 Interest and other income (loss), net 352 730 Income before provision for income taxes 14,571 13,039 Provision for income taxes 2,950 12,929 Net income $11,621 $110 Cisco Systems Inc. Consolidated Balance Sheets In millions, except par value Assets Current assets Cash and cash equivalents $11,750 $8,934 Investments 21,663 37614 Accounts receivable, net of allowance for doubtful accounts 5,491 5,554 Inventories 1,383 1,846 Financing receivables, net 5,095 4949 Other current assets 2,373 2,940 Total current assets 47,755 61,837 Property and equipment, net 2,789 3,006 Financing receivables, net 4,958 4882 g m ey e em Goodwill Purchased intangible assets, net Deferred tax assets Other assets Total assets Liabilities and equity Current liabilities Short-term debt Accounts payable Income taxes payable Accrued compensation Deferred revenue Other current liabilities Total current liabilities Long-term debt Income taxes payable Deferred revenue Other long-term liabilities Total liabilities Equity: Cisco shareholders' equity Preferred stock. no par value: 5 shares authorized : none issued and outstanding 33,529 2,201 4,065 2,496 $97,793 $10,191 2,059 1,149 3,221 10,668 4,424 31,712 14,475 8,927 7,799 1,309 64,222 31,706 2,552 3,219 1,582 $108,784 $5,238 1,904 1,004 2,986 11,490 4,413 27,035 20,331 8,585 8,195 1,434 65,580 4,250 and 4,614 shares issued and outstanding at July 27, 2019, and July 28, 2018, respectively 40,266 ~ 42,820 (Accumulated deficit) Retained earnings (5,903) 1,233 Accumulated other comprehensive income (loss) (792) (849) Total Cisco shareholders' equity 33,571 43,204 Total equity 33,571 43,204 Total liabilities and equity $97,793 $108,784 Federal and state statutory tax rate 22% (a) Compute net operating assets (NOA) for 2019. Hint: Treat Financing receivable as operating assets. 1,737 % (b) Compute net operating profit after tax (NOPAT) for 2019, assuming a federal and state statutory tax rate of 22%. Assume that all items on the 2019 income statement will persist. NOPAT 4,947 % (c) Use the parsimonious forecast method, as shown in Analysis Insight box on page 14-5 and in Exhibit 14.2, to forecast Cisco's sales, NOPAT, and NOA for 2020 through 2023 and the terminal period using the following assumptions. Note: When completing the question in Excel, refer directly to the cells containing calculated assumptions for NOPM and NOAT, i.e., don't type the NOPM number when making a calculation, refer to the cell. Assumptions Sales growth 2020-2023 5% Terminal growth 1% Net operating profit margin (NOPM) 2019 rate Net operating asset turnover (NOAT) 2019 rate Hint: Use 2019 NOA, not average NOA, to compute the 2019 rate for NOAT. CSCO Reported Forecast Horizon Terminal ($ millions) 2019 2020 Est. 2021 Est. 2022 Est. 2023 Est. Period Sales $ 51,904 V $ 54,499.2 ~ $ 57,224.16 v $ 60,085.37 v $ 63,089.64 v $ 63,720.53 NOPAT = Forecasted sales x NOPM assumption 11,346 v 11,635 x 12,217 x 12,828 x 13,469 x 13,617 x NOA = Forecasted sales / NOAT assumption 24,824 V 67,610 x 71,090 x 74,645 X 78,377 x 79,165 X (d) Estimate the value of a share of Cisco common stock using the residual operating income (ROPI) model as of July 27, 2019; assume a discount rate (WACC) of 7.6%, common shares outstanding of 5,029 million, and net nonoperating obligations (NNO) of $(8,747) million (NNO is negative, which means that Cisco has net nonoperating investments). Assumptions Discount rate (WACC) 7.60% Common shares outstanding 5,029 million Net nonoperating obligations (NNO) |$(8,747) million NNO is negative, which means that Cisco has net nonoperating investmentsNNO is negative, which means that Cisco has net nonoperating investments Reported Forecast Horizon Terminal ($ millions) 2019 2020 2021 2022 2023 Period ROPI (NOPAT - [NOABeg x rw]) $ 10,048 x $ 10,551 x $ 11,079 * $ 11,633 x $ 11,662 X Present value of horizon ROPI 9,338 X 9, 113 x 8,893 x 8,678 x Cum present value of horizon ROPI $ 46,975 x Present value of terminal ROPI 9,429 X NOA 24,824 v Total firm value 56,404 x Less NNO (8,747) Firm equity value $ 47,657 x Shares outstanding (millions) 5,029 V Stock price per share $ 40.05
Step by Step Solution
There are 3 Steps involved in it
1 Expert Approved Answer
Step: 1 Unlock
Question Has Been Solved by an Expert!
Get step-by-step solutions from verified subject matter experts
Step: 2 Unlock
Step: 3 Unlock
Students Have Also Explored These Related Finance Questions!