

Question: Form, strength, direction Results - Simple Linear Regression X Fitted Plot 560 - 520 - SATMath 480 - . . 440 - 25 30 35
Form, strength, direction
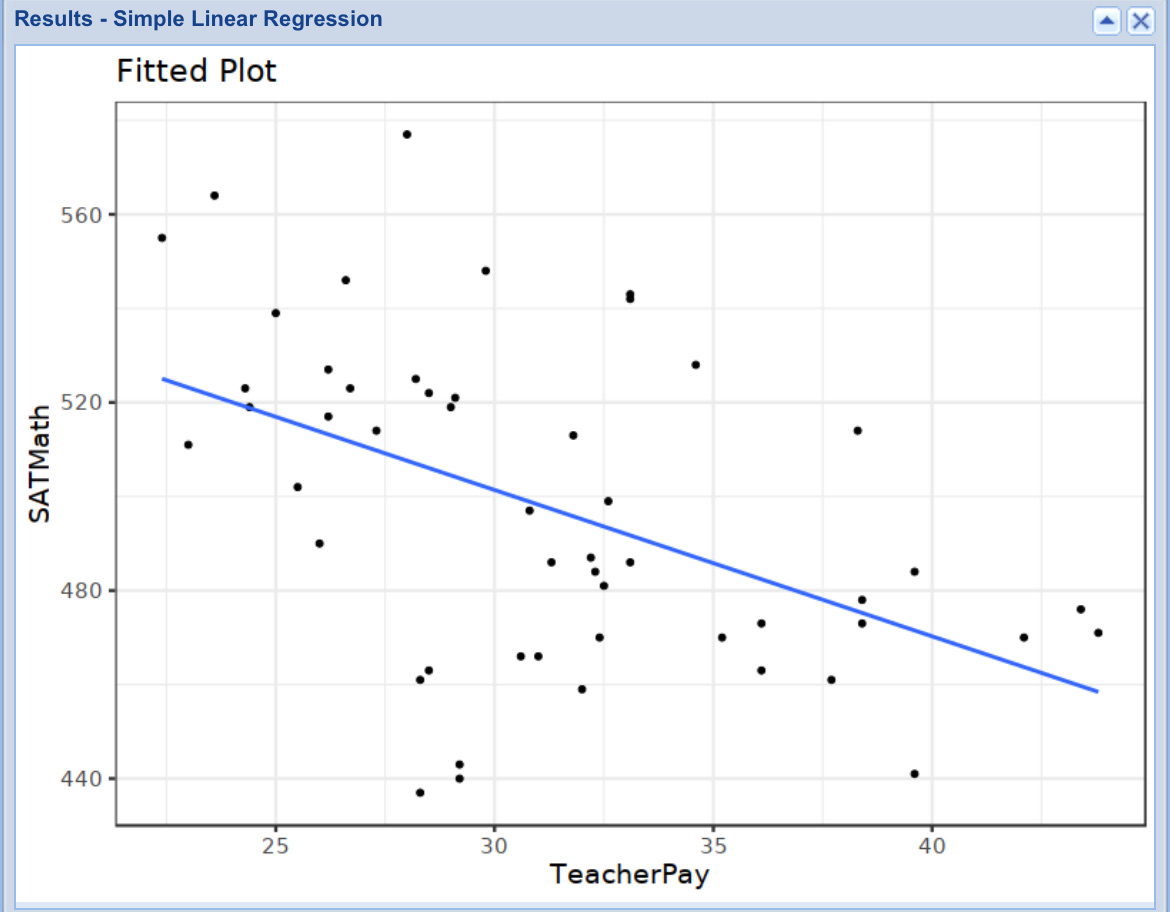
Results - Simple Linear Regression X Fitted Plot 560 - 520 - SATMath 480 - . . 440 - 25 30 35 40 TeacherPay
Step by Step Solution
There are 3 Steps involved in it
1 Expert Approved Answer
Step: 1 Unlock

Question Has Been Solved by an Expert!
Get step-by-step solutions from verified subject matter experts
Step: 2 Unlock
Step: 3 Unlock