

Question: Format the following data into a income statement and a balance sheet for years ending 2018,2019,2020. Also calculate the following following ratios: receivable turnover,inventory turnover,
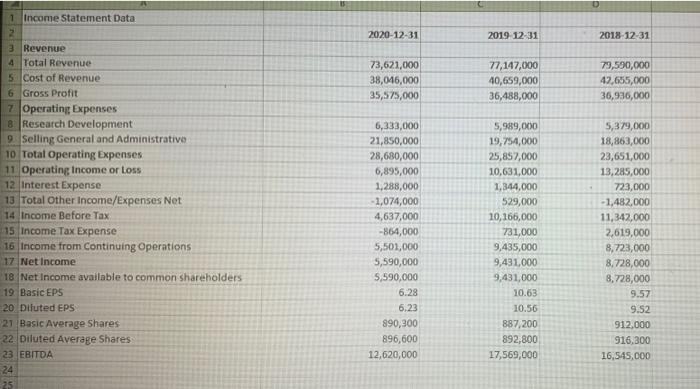
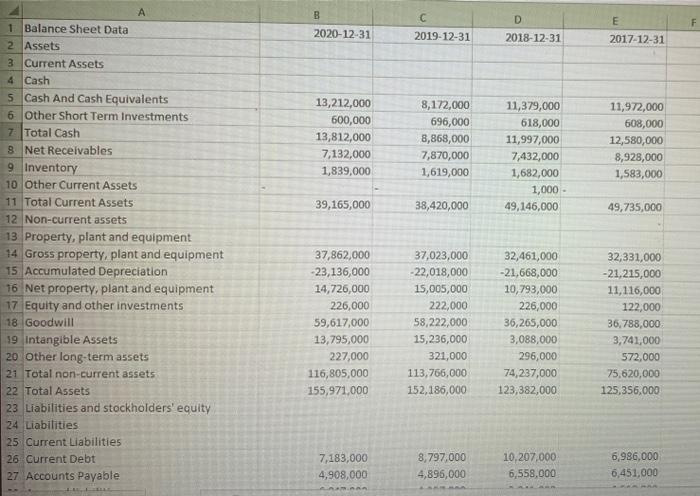
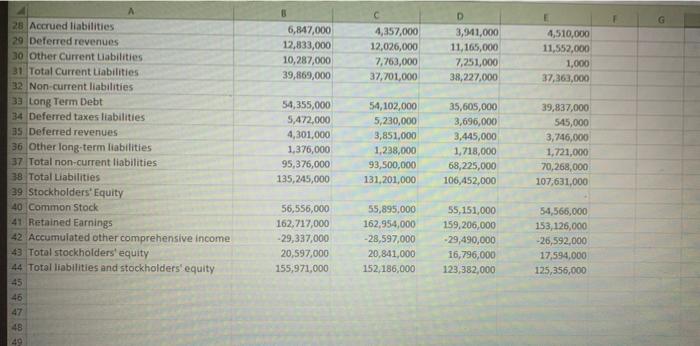
D 2020-12-31 2019-12-31 2018-12-31 73,621,000 38,046,000 35,575,000 77,147,000 40,659,000 36,488,000 79,590,000 42.655,000 36,936,000 1 Income Statement Data 2 3 Revenue 4 Total Revenue 5 Cost of Revenue 6 Gross Profit 7 Operating Expenses 8 Research Development 9. Selling General and Administrative 10 Total Operating Expenses 11 Operating Income or loss 12 Interest Expense 13 Total Other Income/expenses Net 14 Income Before Tax 15 Income Tax Expense 16 Income from Continuing Operations 17 Net Income 18 Net Income available to common shareholders 19 Basic EPS 20 Diluted EPS 21 Basic Average Shares 22 Diluted Average Shares 23 EBITDA 24 25 6,333,000 21,850,000 28,680,000 6,895,000 1,288,000 -1,074,000 4,637,000 -864,000 5,500,000 5,590,000 5,590,000 6.28 6,23 890,300 896,600 12,620,000 5,989,000 19,754,000 25,857,000 10,631,000 1,344,000 529,000 10,165,000 731,000 9,435,000 9,431,000 9,431,000 10.63 10.56 887,200 892,800 17,569,000 5,379,000 18,863,000 23,651,000 13,285,000 723,000 -1,482,000 11,342,000 2,619,000 8,723,000 8,728,000 8,728,000 9.57 9.52 912.000 916,300 16,545,000 B D F 2020-12-31 2019-12-31 E 2017-12-31 2018-12-31 13,212,000 600,000 13,812,000 7,132,000 1,839,000 8,172,000 696,000 8,868,000 7,870,000 1,619,000 11,379,000 618,000 11,997,000 7,432,000 1,682,000 1,000 - 49,146,000 11,972,000 608,000 12,580,000 8,928,000 1,583,000 39,165,000 38,420,000 49,735,000 1 Balance Sheet Data 2 Assets 3 Current Assets 4 Cash 5 Cash And Cash Equivalents 6 Other Short Term Investments 7 Total Cash 8 Net Receivables 9 Inventory 10 Other Current Assets 11 Total Current Assets 12 Non-current assets 13 Property, plant and equipment 14 Gross property, plant and equipment 15 Accumulated Depreciation 16 Net property, plant and equipment 17 Equity and other investments 18 Goodwill 19 Intangible Assets 20 other long-term assets 21 Total non-current assets 22 Total Assets 23 Liabilities and stockholders' equity 24 Liabilities 25 Current Liabilities 26 Current Debt 27 Accounts Payable 37,862,000 -23,136,000 14,726,000 226,000 59,617,000 13,795,000 227,000 116,805,000 155,971.000 37,023,000 -22,018,000 15,005,000 222,000 58,222,000 15,236,000 321,000 113,766,000 152,186,000 32,461,000 -21,668,000 10,793,000 226,000 36,265,000 3,088,000 296,000 74,237,000 123,382,000 32,331,000 -21,215,000 11,116,000 122,000 36,788,000 3,741,000 572,000 75,620,000 125,356,000 7.183,000 4,908,000 8,797,000 4,896,000 10,207,000 6,558,000 6,986,000 6,451,000 6,847,000 12,833,000 10,287,000 39,869,000 4,357,000 12,026,000 7.763,000 37,701,000 D 3,M1,000 11,165,000 7,251,000 38,227.000 4,510,000 11,552,000 1,000 37,363,000 28 Accrued liabilities 29 Deferred revenues 30 Other Current Liabilities 31 Total Current liabilities 32 Non-current liabilities 33 Long Term Debt 34 Deferred taxes liabilities 35 Deferred revenues 36 Other long-term liabilities 37 Total non-current liabilities 38 Total Liabilities 39 Stockholders' Equity 40 Common Stock 41 Retained Earnings 42 Accumulated other comprehensive income 43 Total stockholders' equity 44 Total liabilities and stockholders' equity 45 46 47 48 54,355,000 5,472,000 4,301,000 1,376,000 95,376,000 135, 245,000 54,102,000 5,230,000 3,851.000 1,238,000 93,500,000 131,201,000 35,605,000 3,696,000 3,445,000 1,718,000 68,225,000 106,452,000 39,837,000 545,000 3,746,000 1,721,000 70,268,000 107,631,000 56,556,000 162.717,000 -29,337,000 20,597,000 155,971,000 55,895,000 162,954,000 -28,597,000 20,841,000 152, 186,000 55,151,000 159,206,000 -29,490,000 16,796,000 123,382,000 54,566,000 153, 125,000 -26,592,000 17,594,000 125,356,000 49
Step by Step Solution
There are 3 Steps involved in it

Get step-by-step solutions from verified subject matter experts