

Question: Formative Assessment No. 3 - Try It Out (10 points) Directions: Analyze the chart below and answer the questions that follow. Write the correct answer
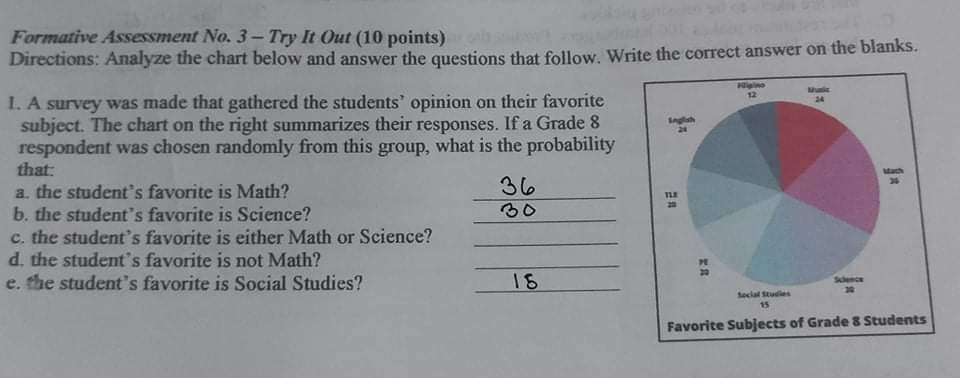
Formative Assessment No. 3 - Try It Out (10 points) Directions: Analyze the chart below and answer the questions that follow. Write the correct answer on the blanks. I. A survey was made that gathered the students' opinion on their favorite 12 subject. The chart on the right summarizes their responses. If a Grade 8 respondent was chosen randomly from this group, what is the probability that: a. the student's favorite is Math? 36 b. the student's favorite is Science? 30 c. the student's favorite is either Math or Science? d. the student's favorite is not Math? e. the student's favorite is Social Studies? 15 45 Favorite Subjects of Grade & Students
Step by Step Solution
There are 3 Steps involved in it

Get step-by-step solutions from verified subject matter experts