

Question: Formatting Table ~ Sty Undo Clipboard Font Alignment Number Styles 1203 XV fx C D G H 25 26 c) How many variables are
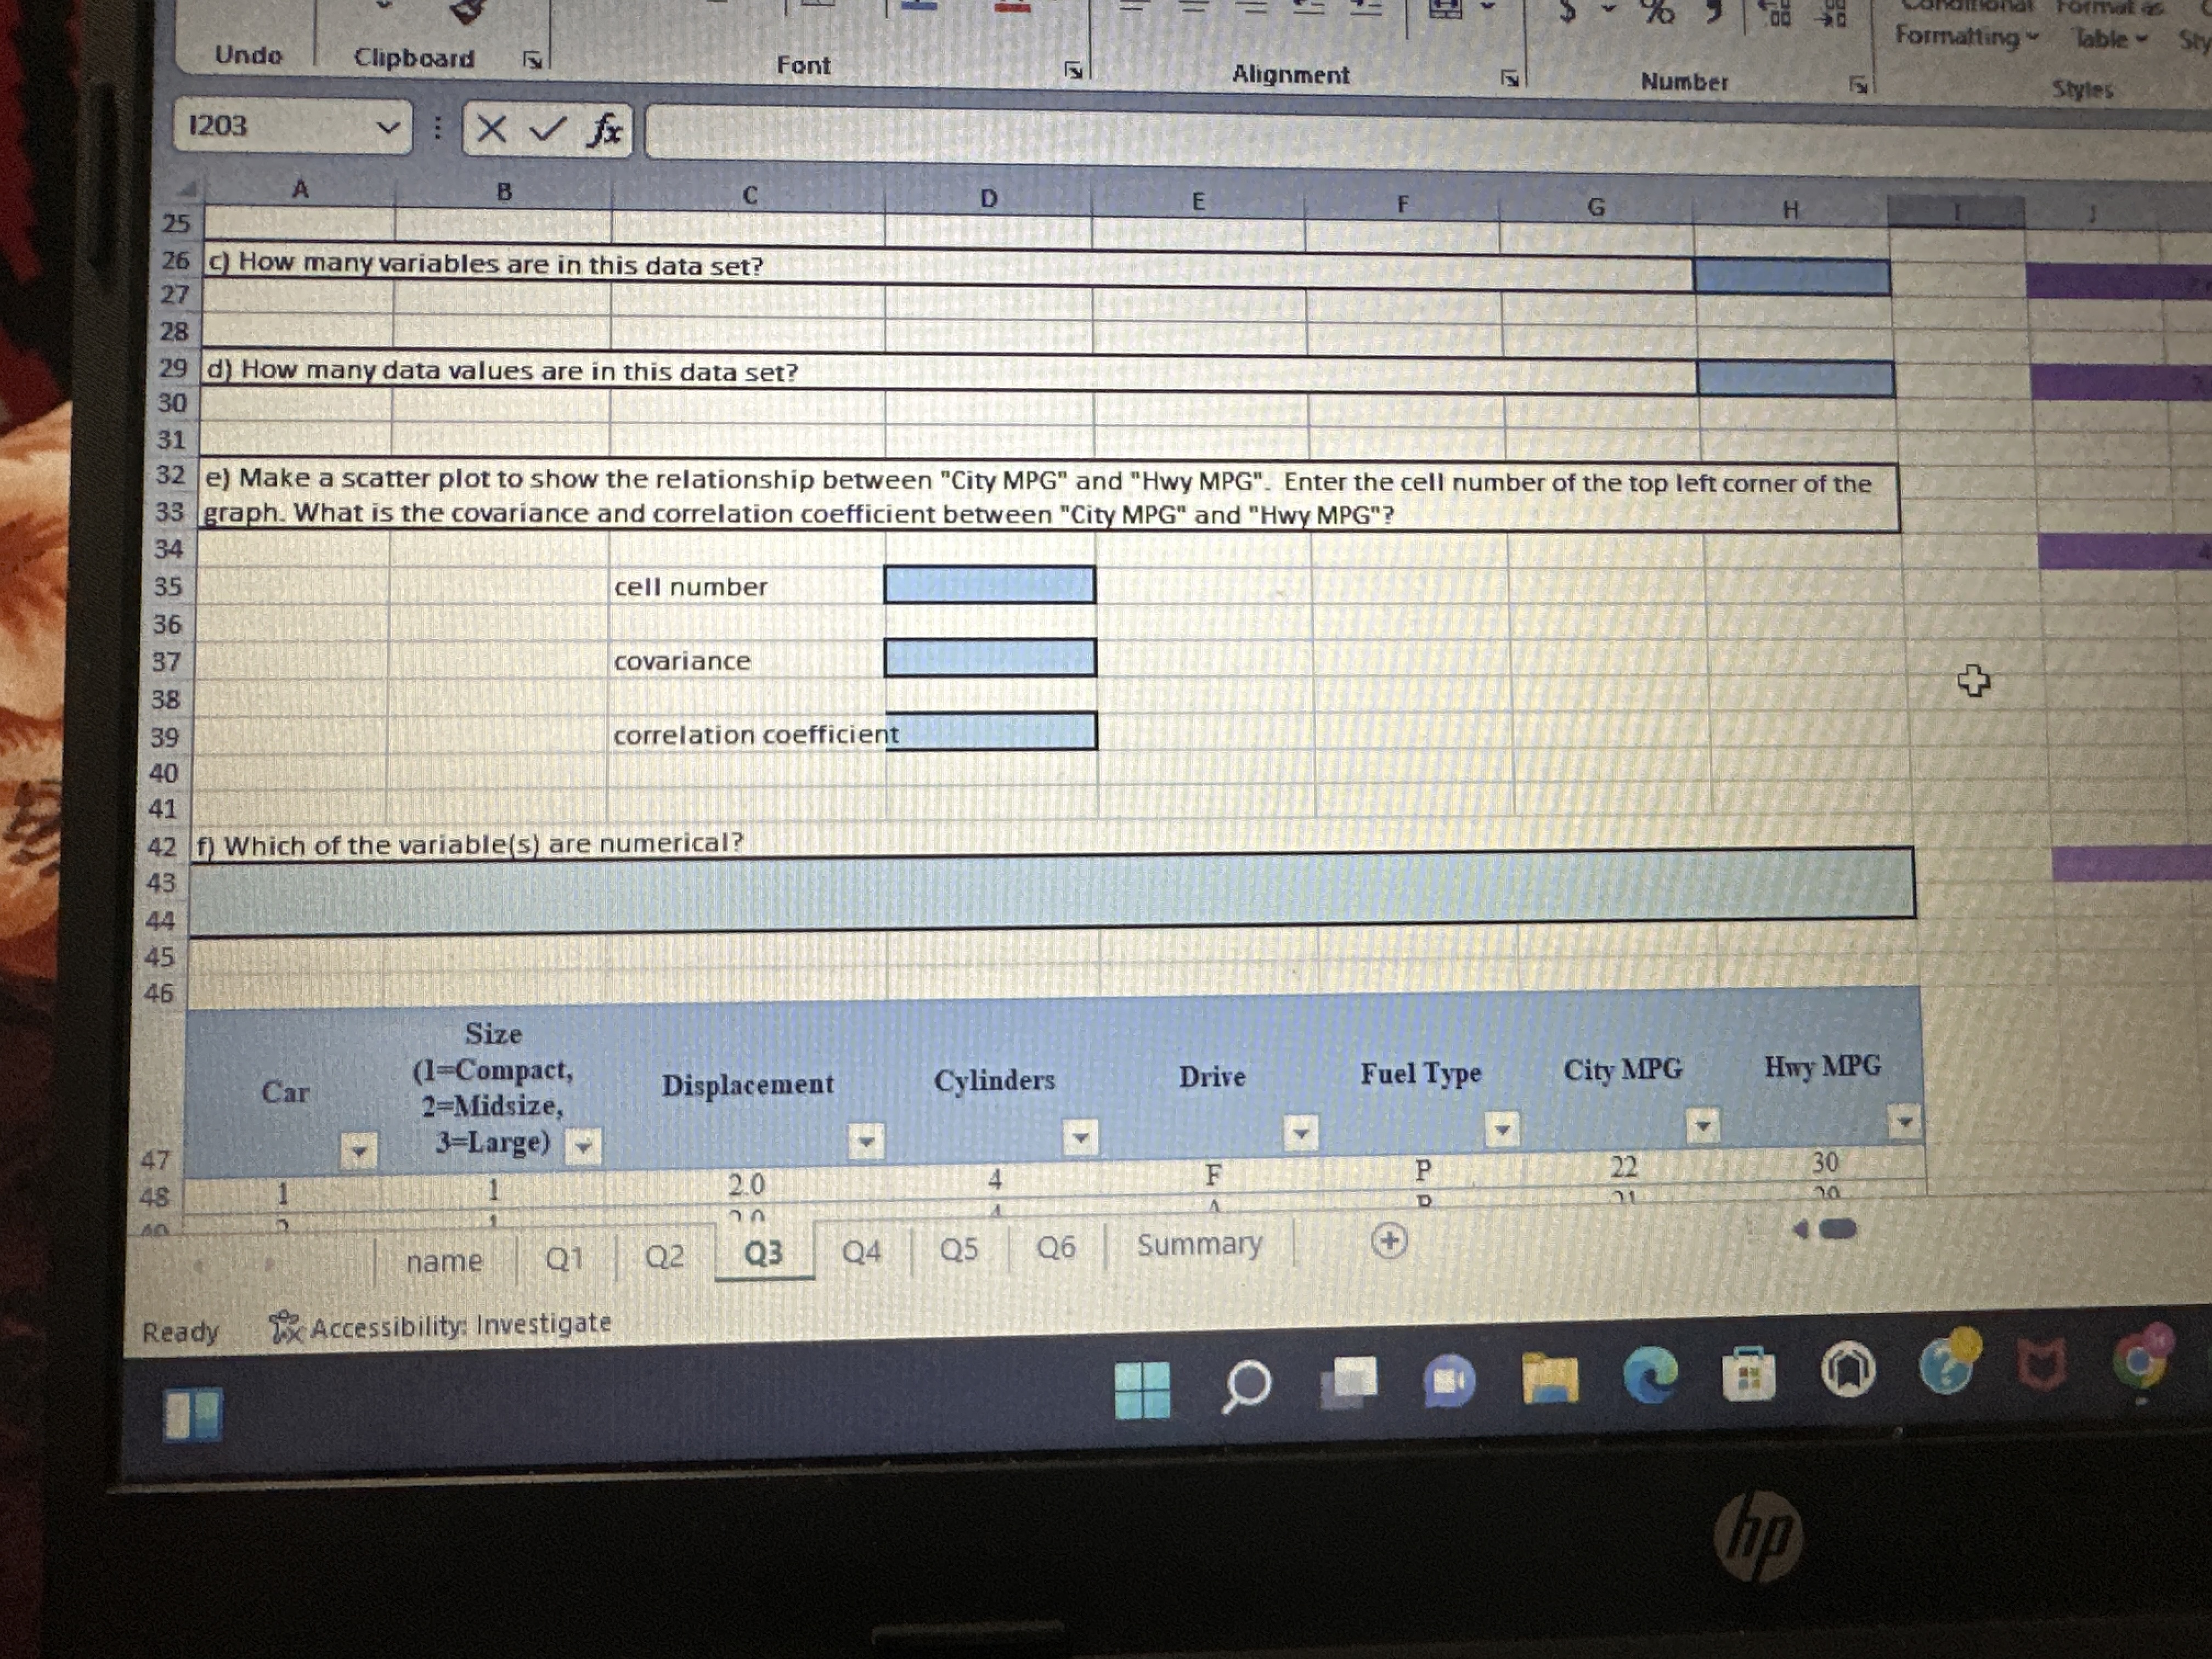

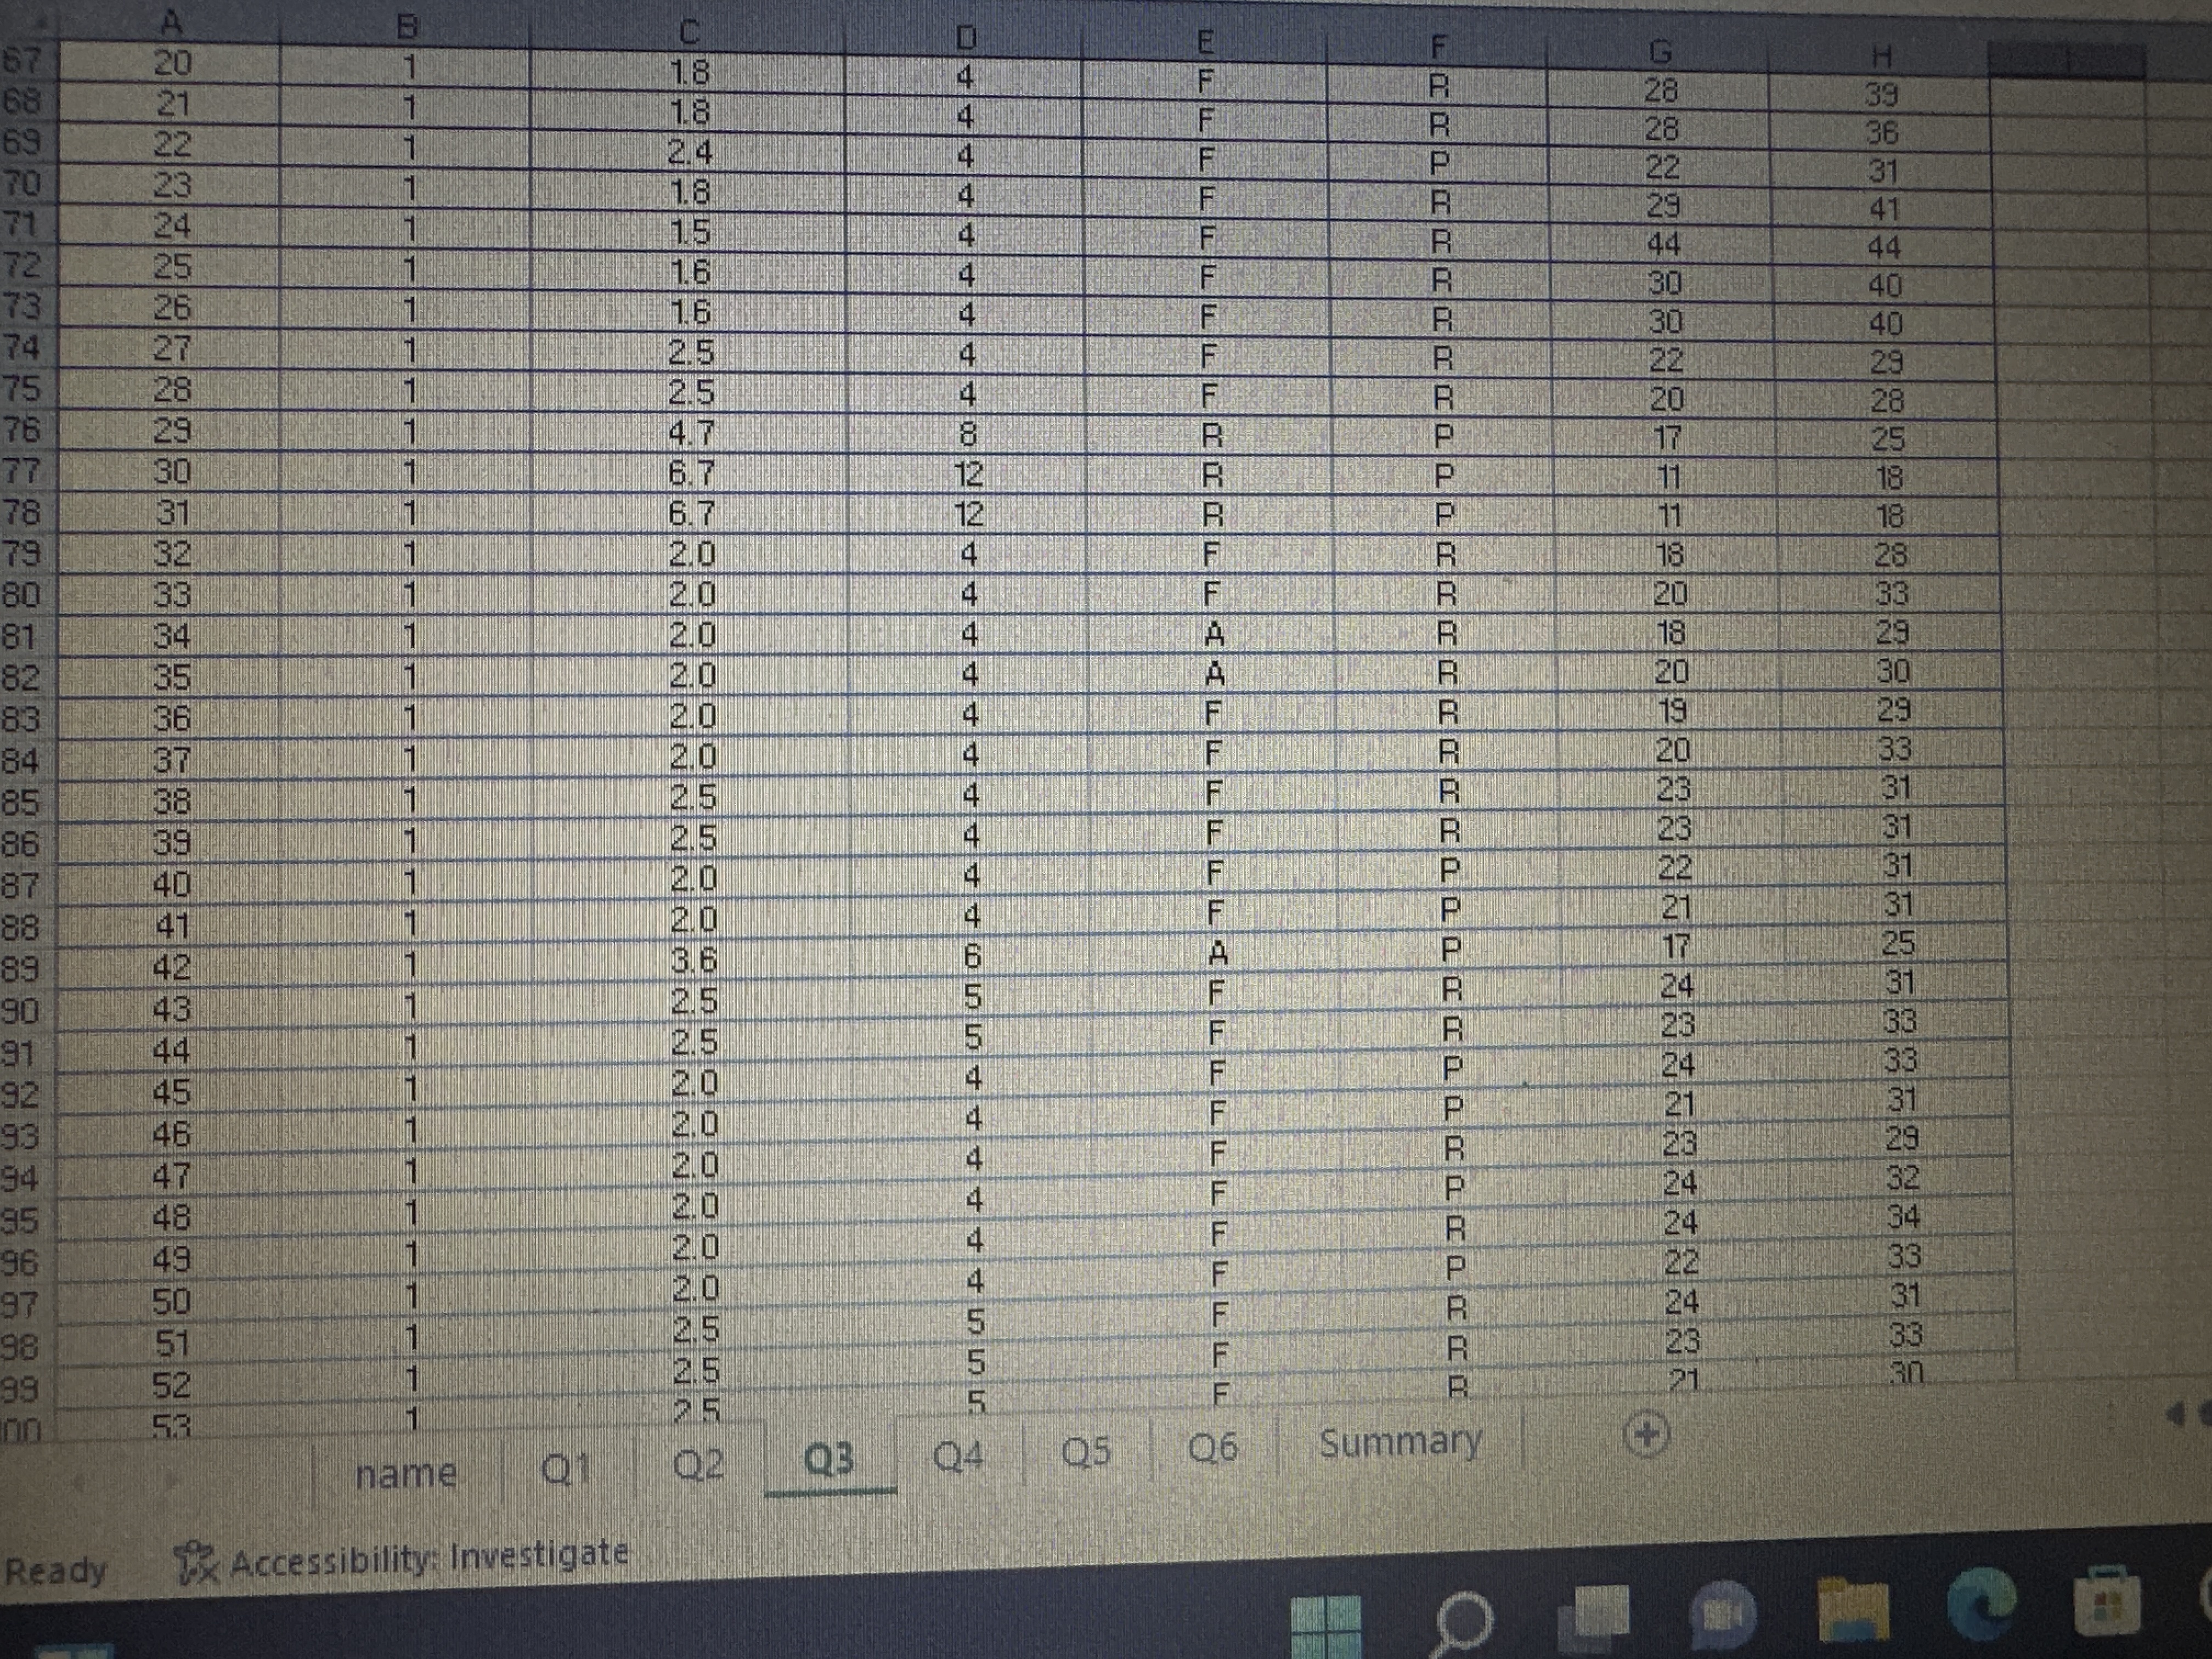


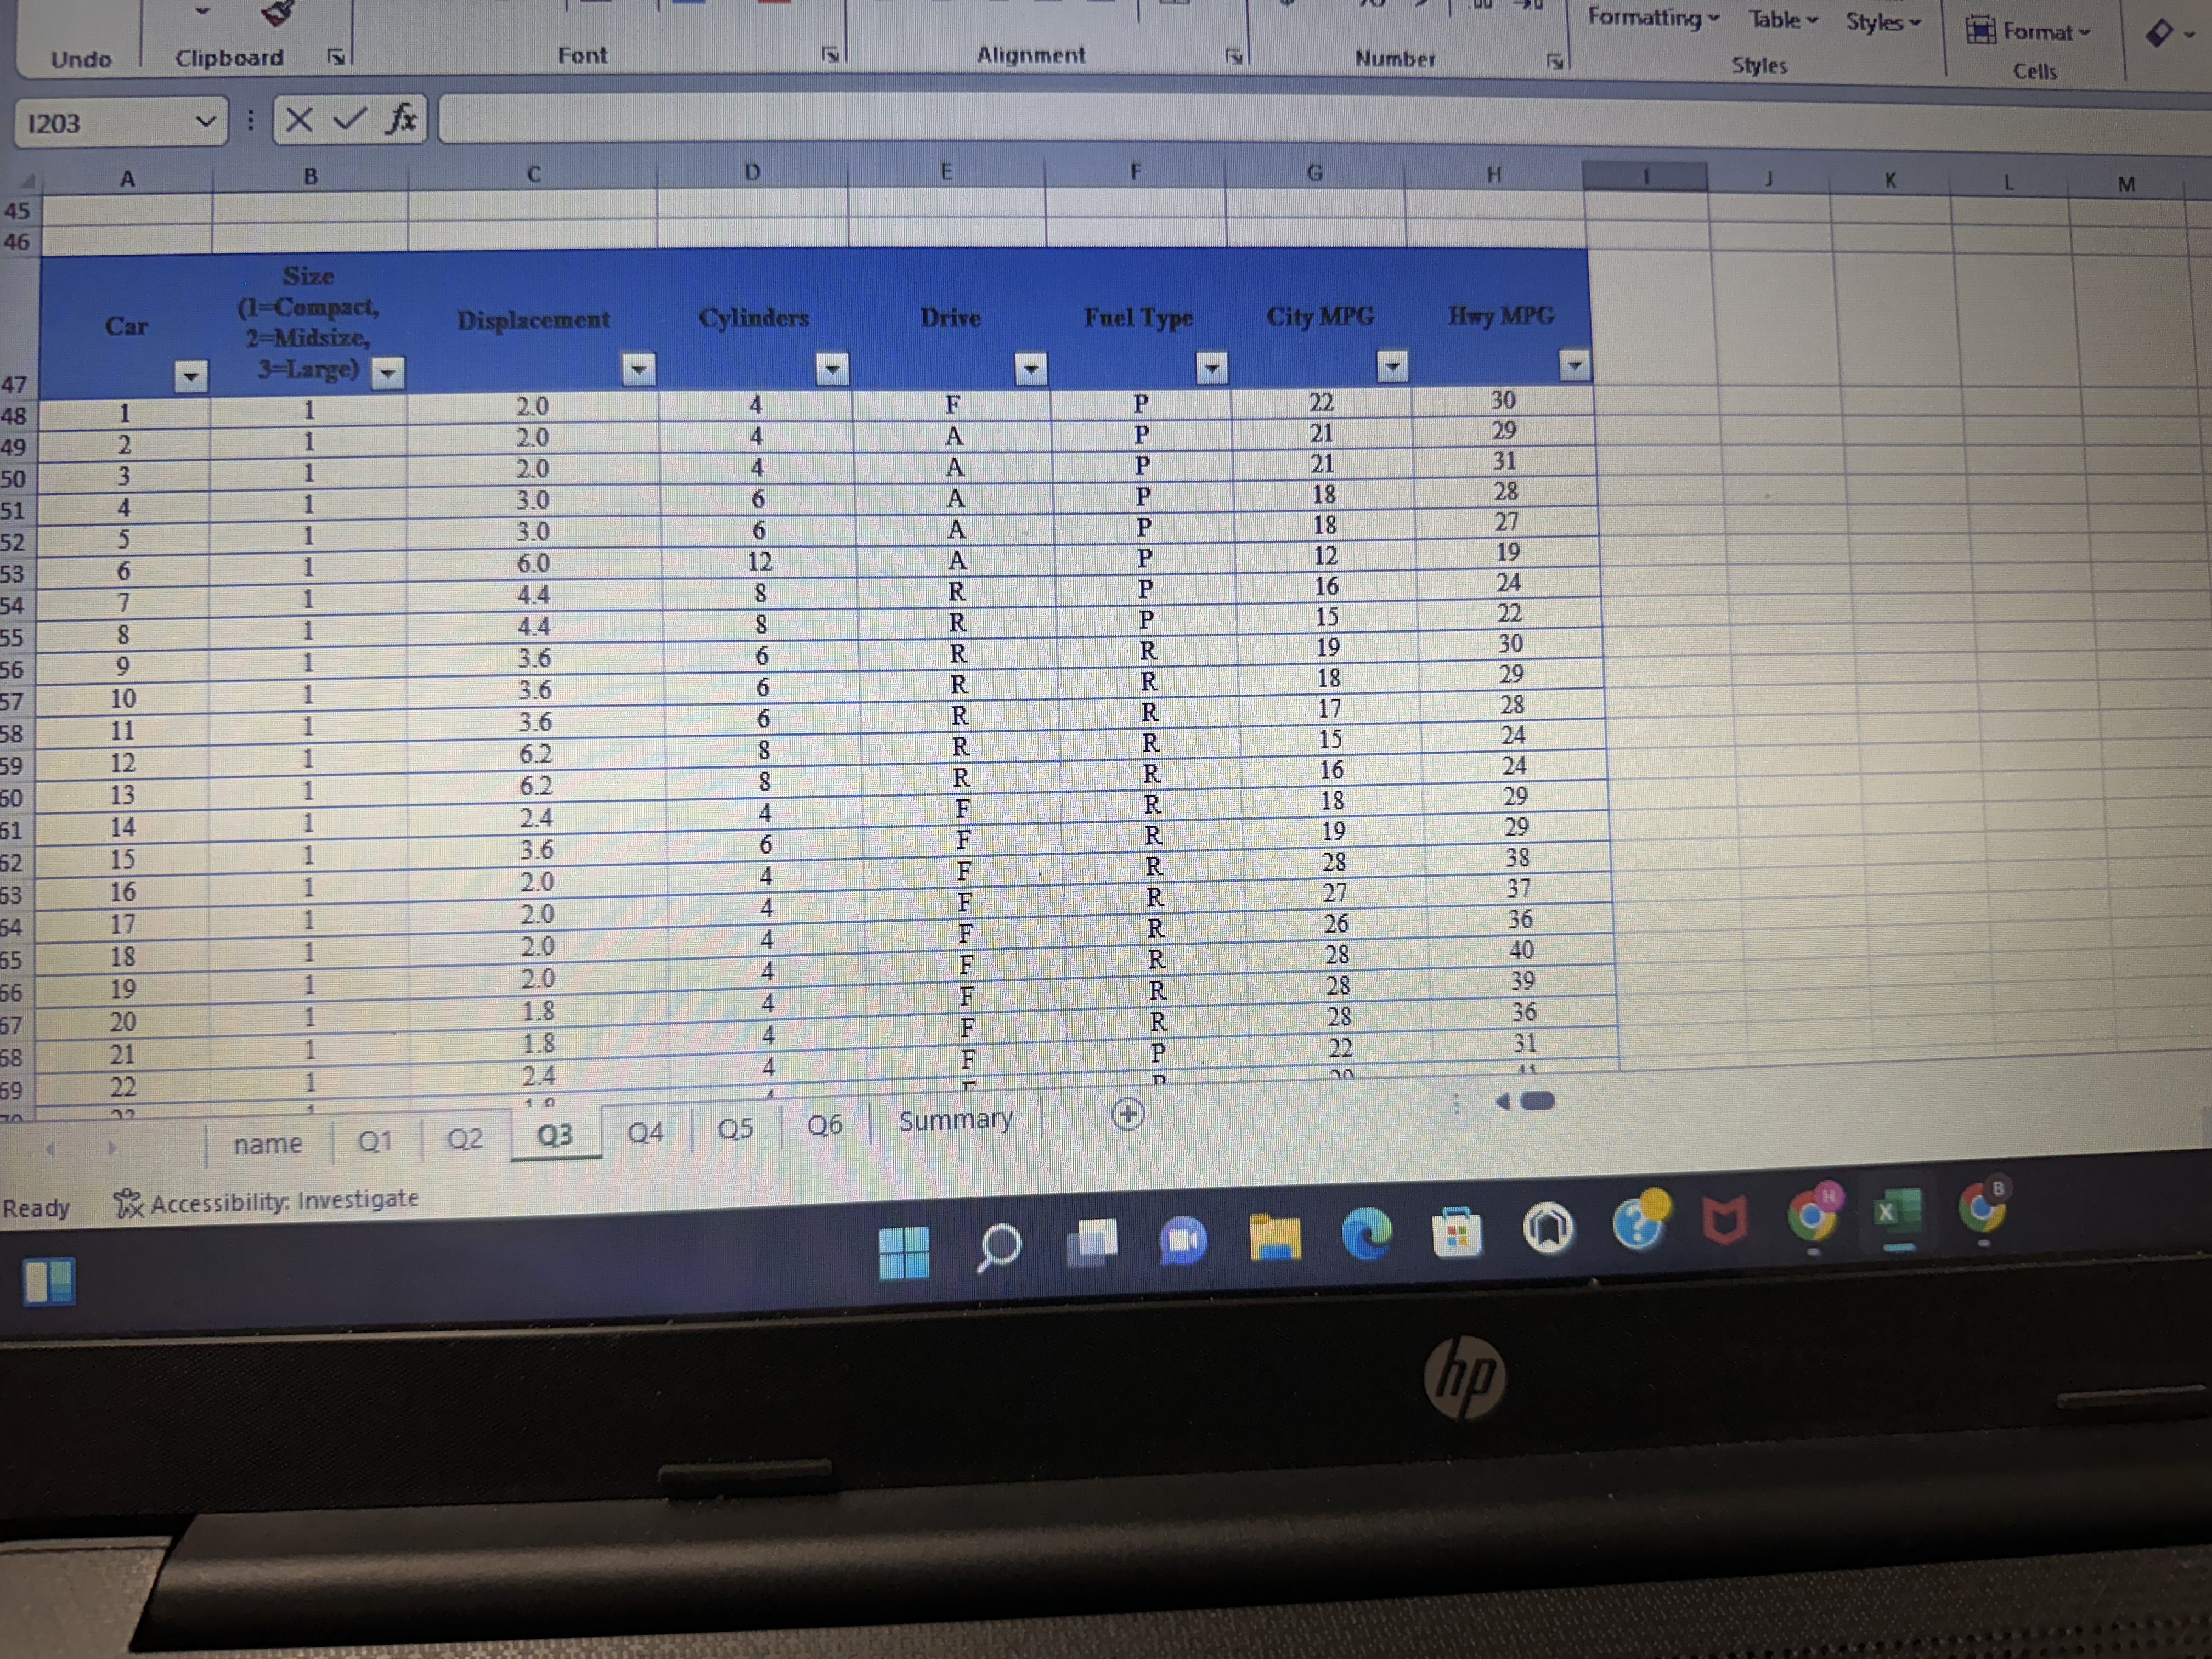

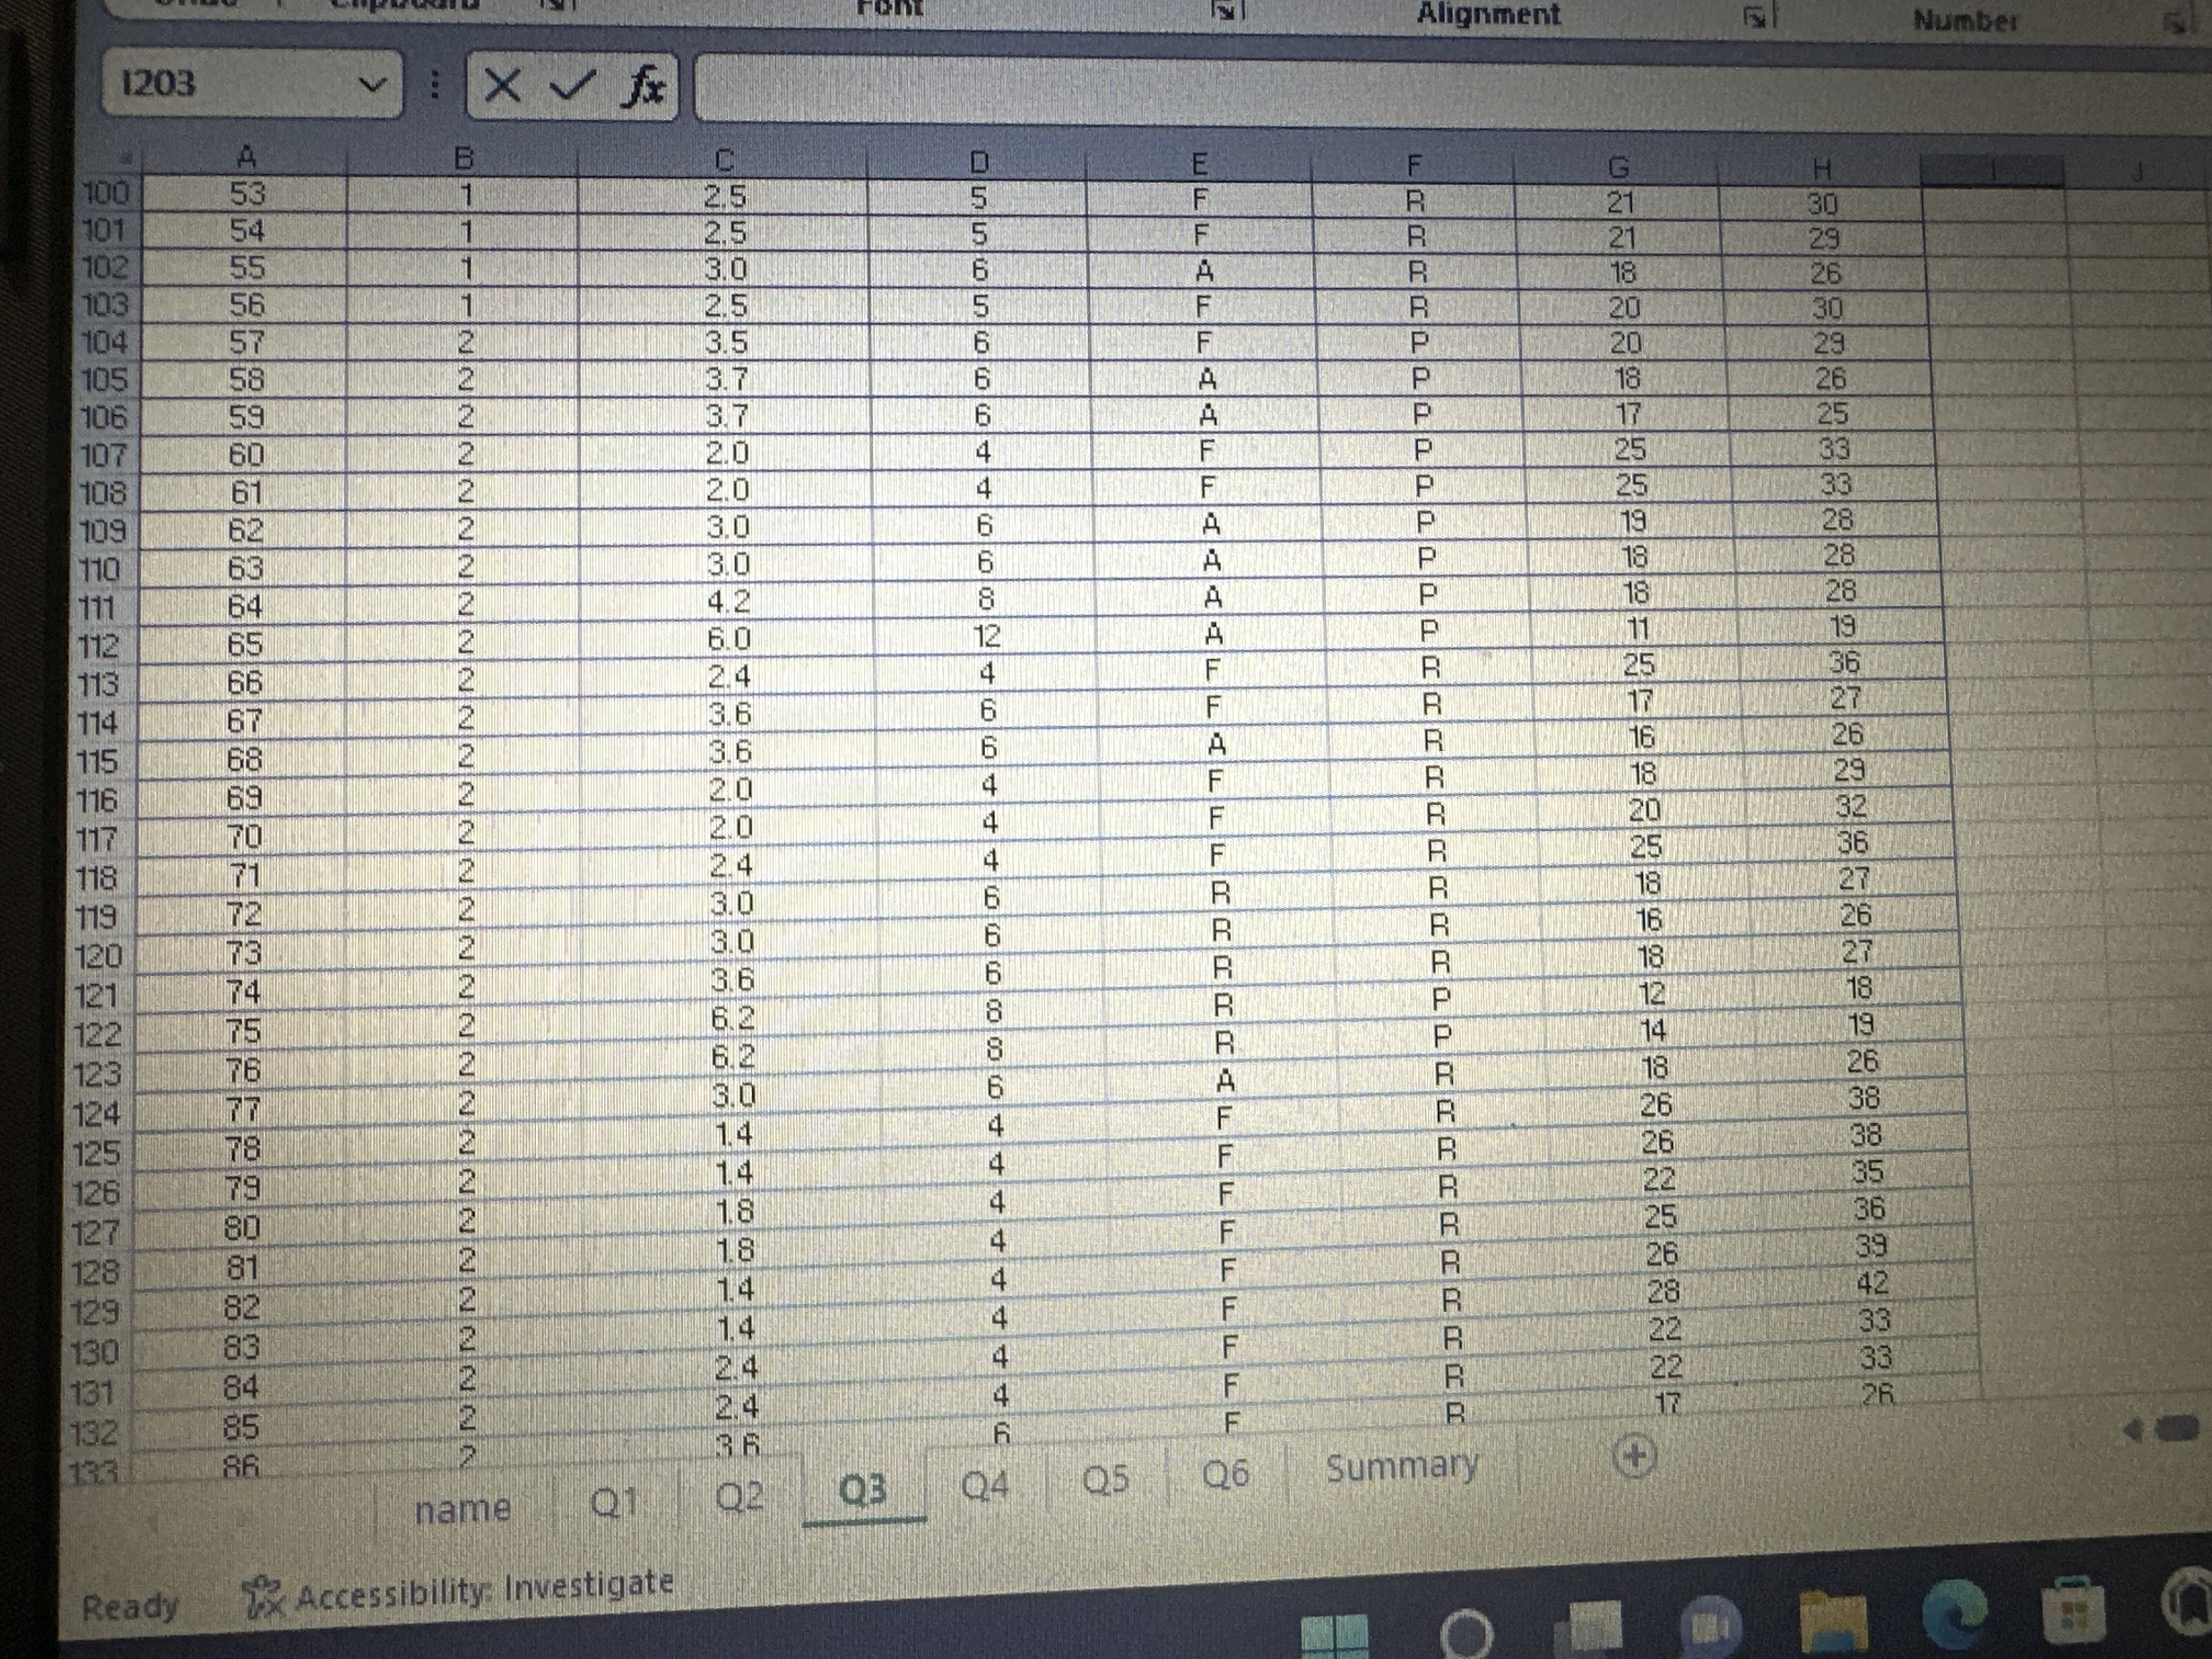
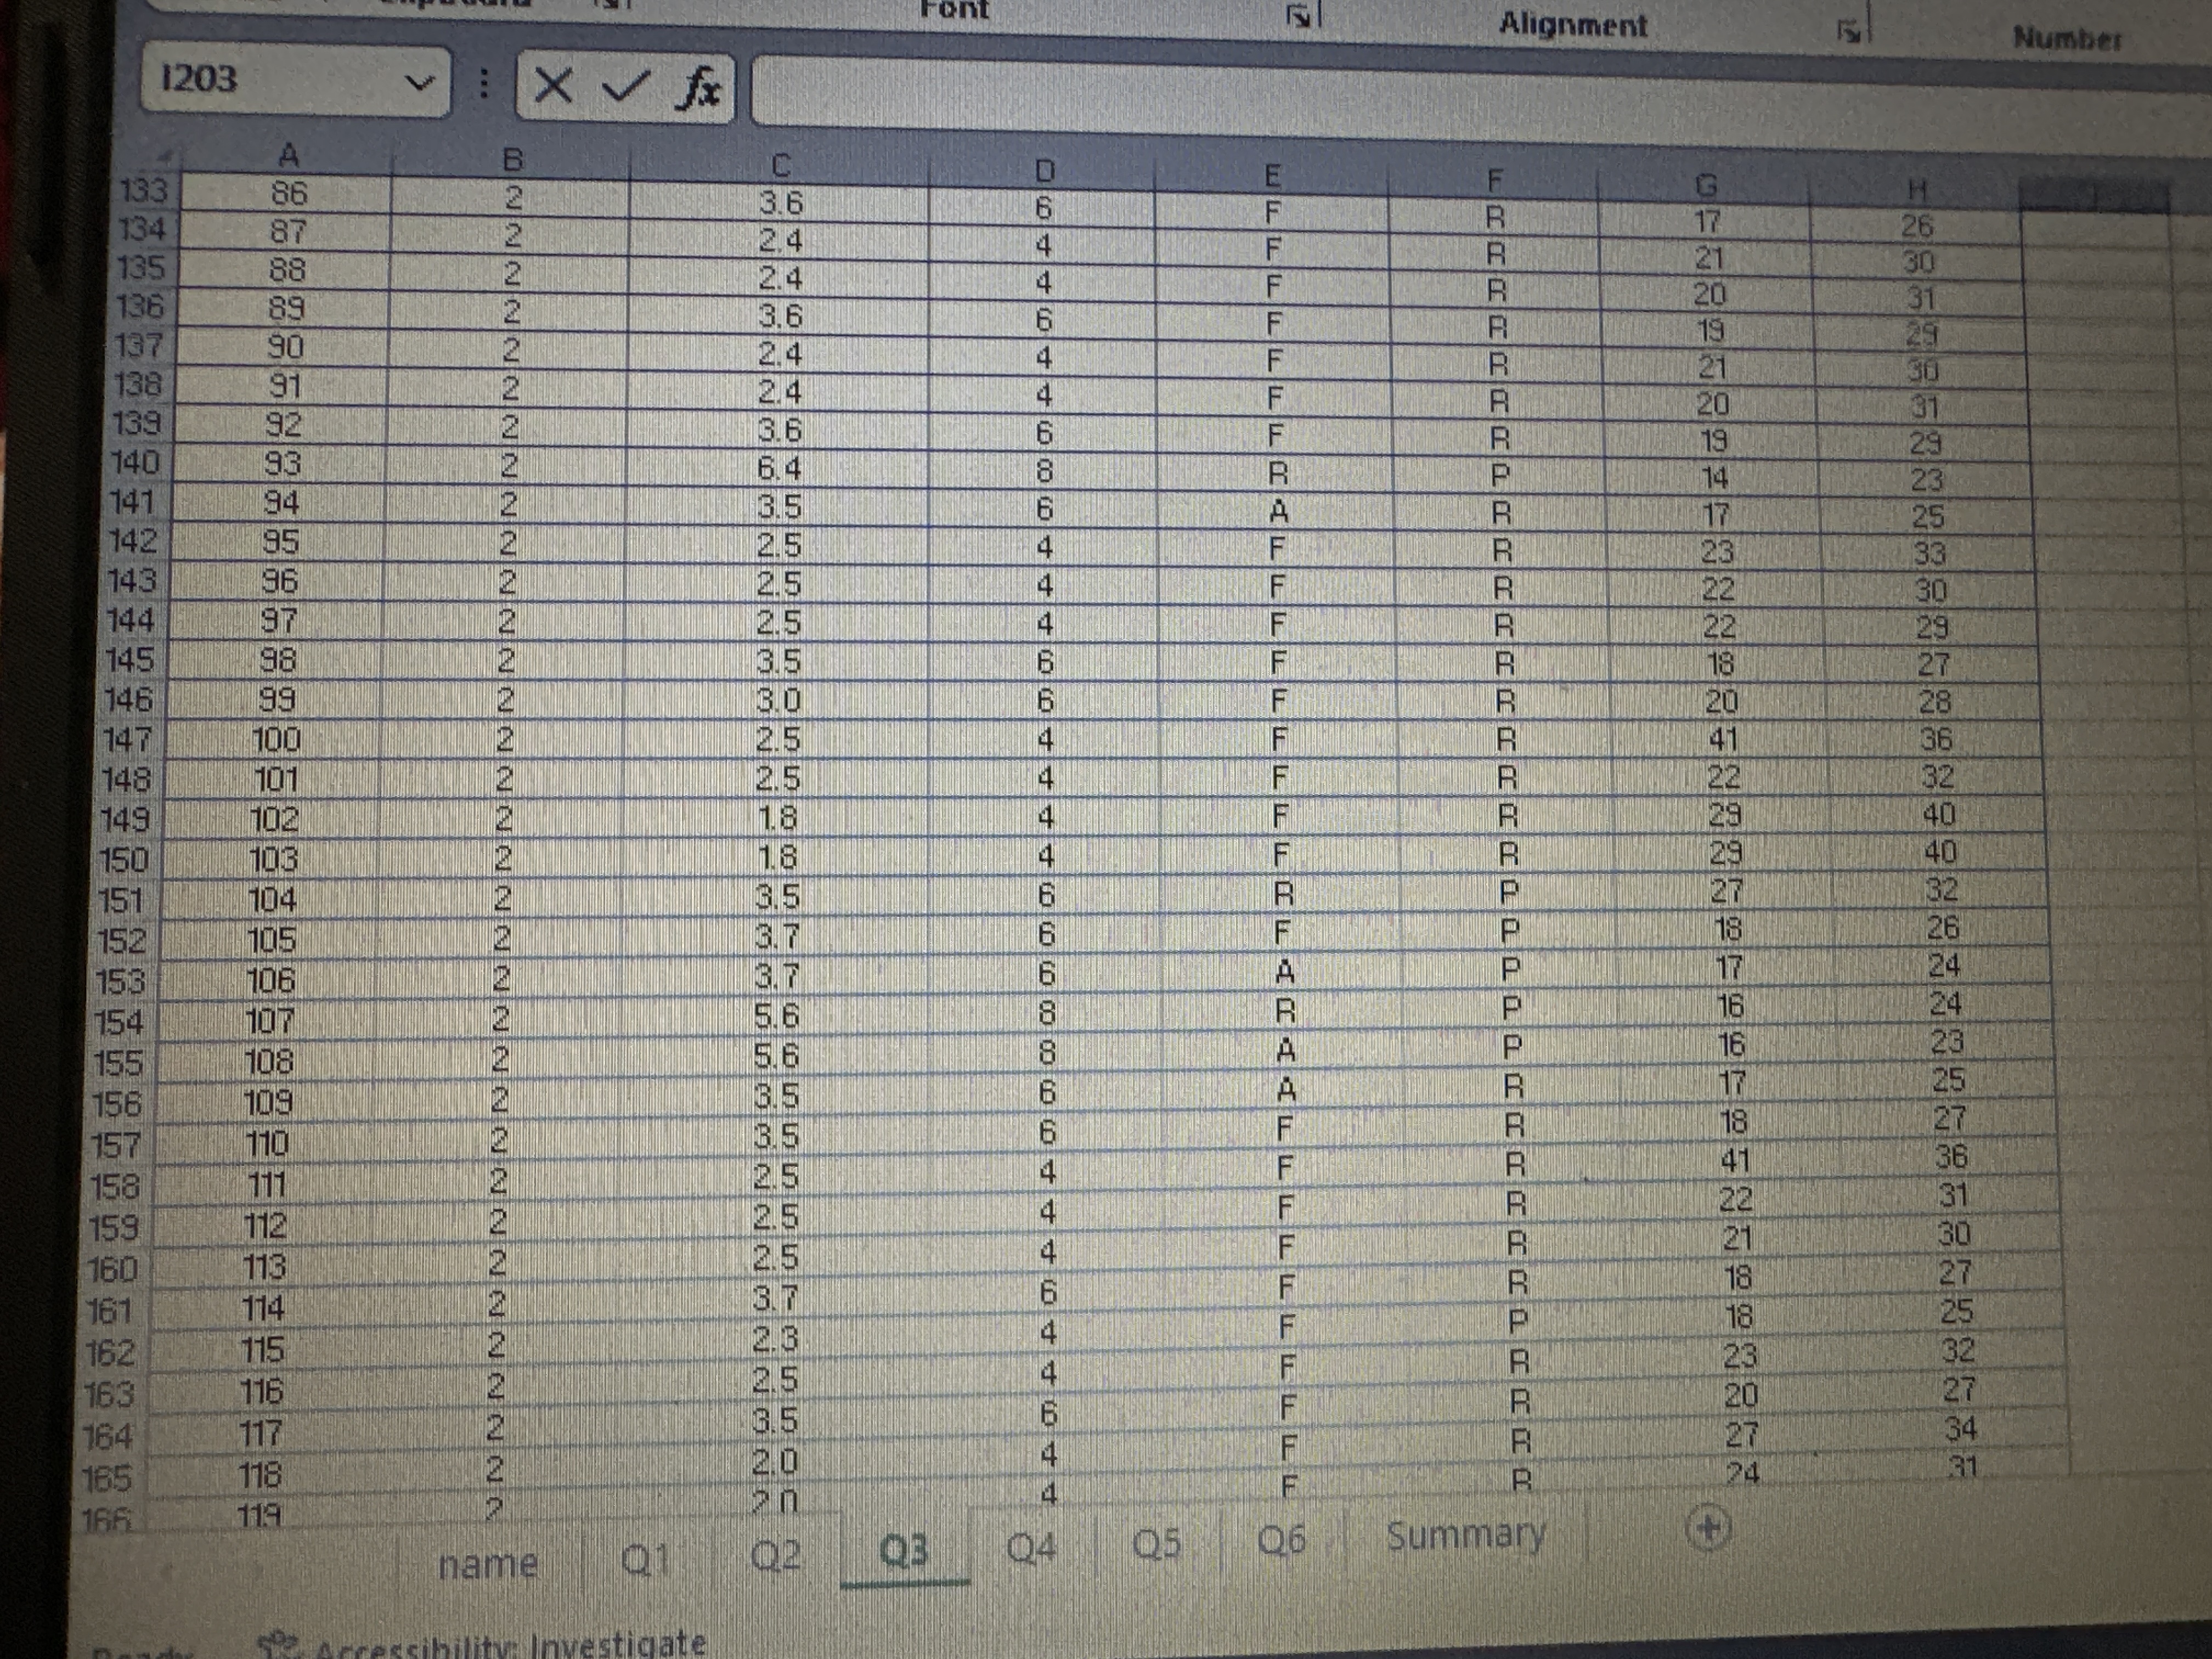
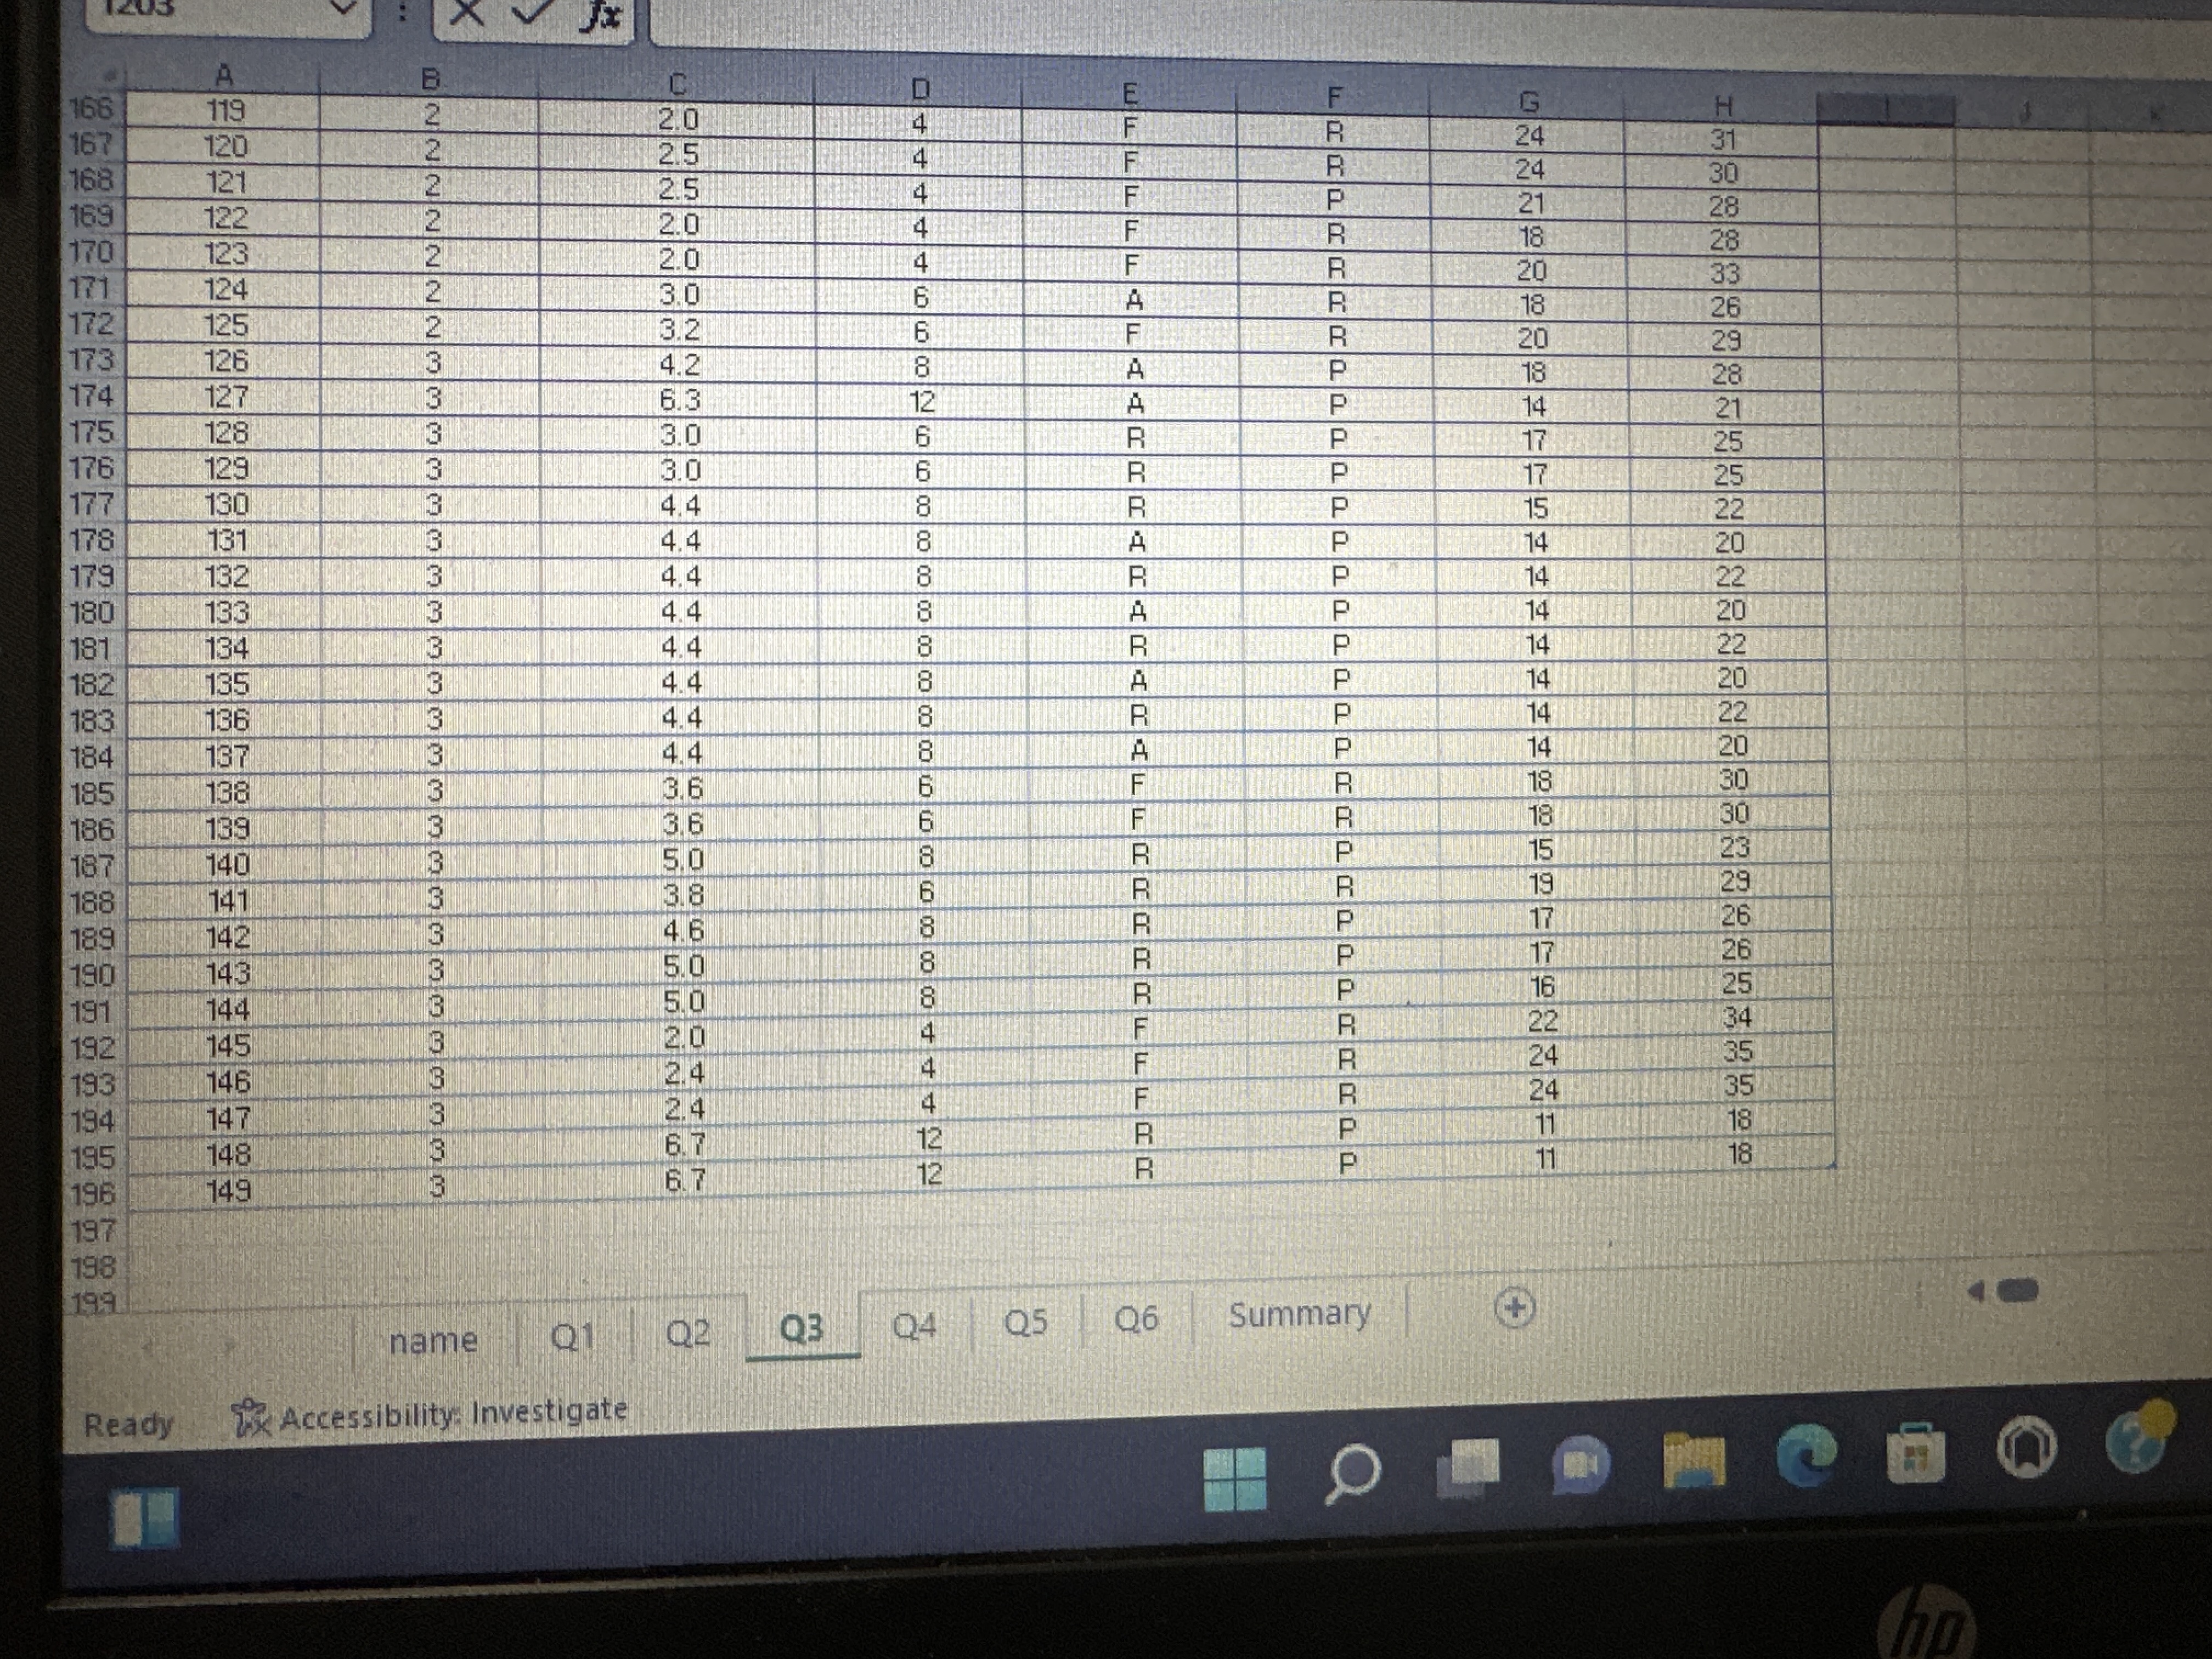
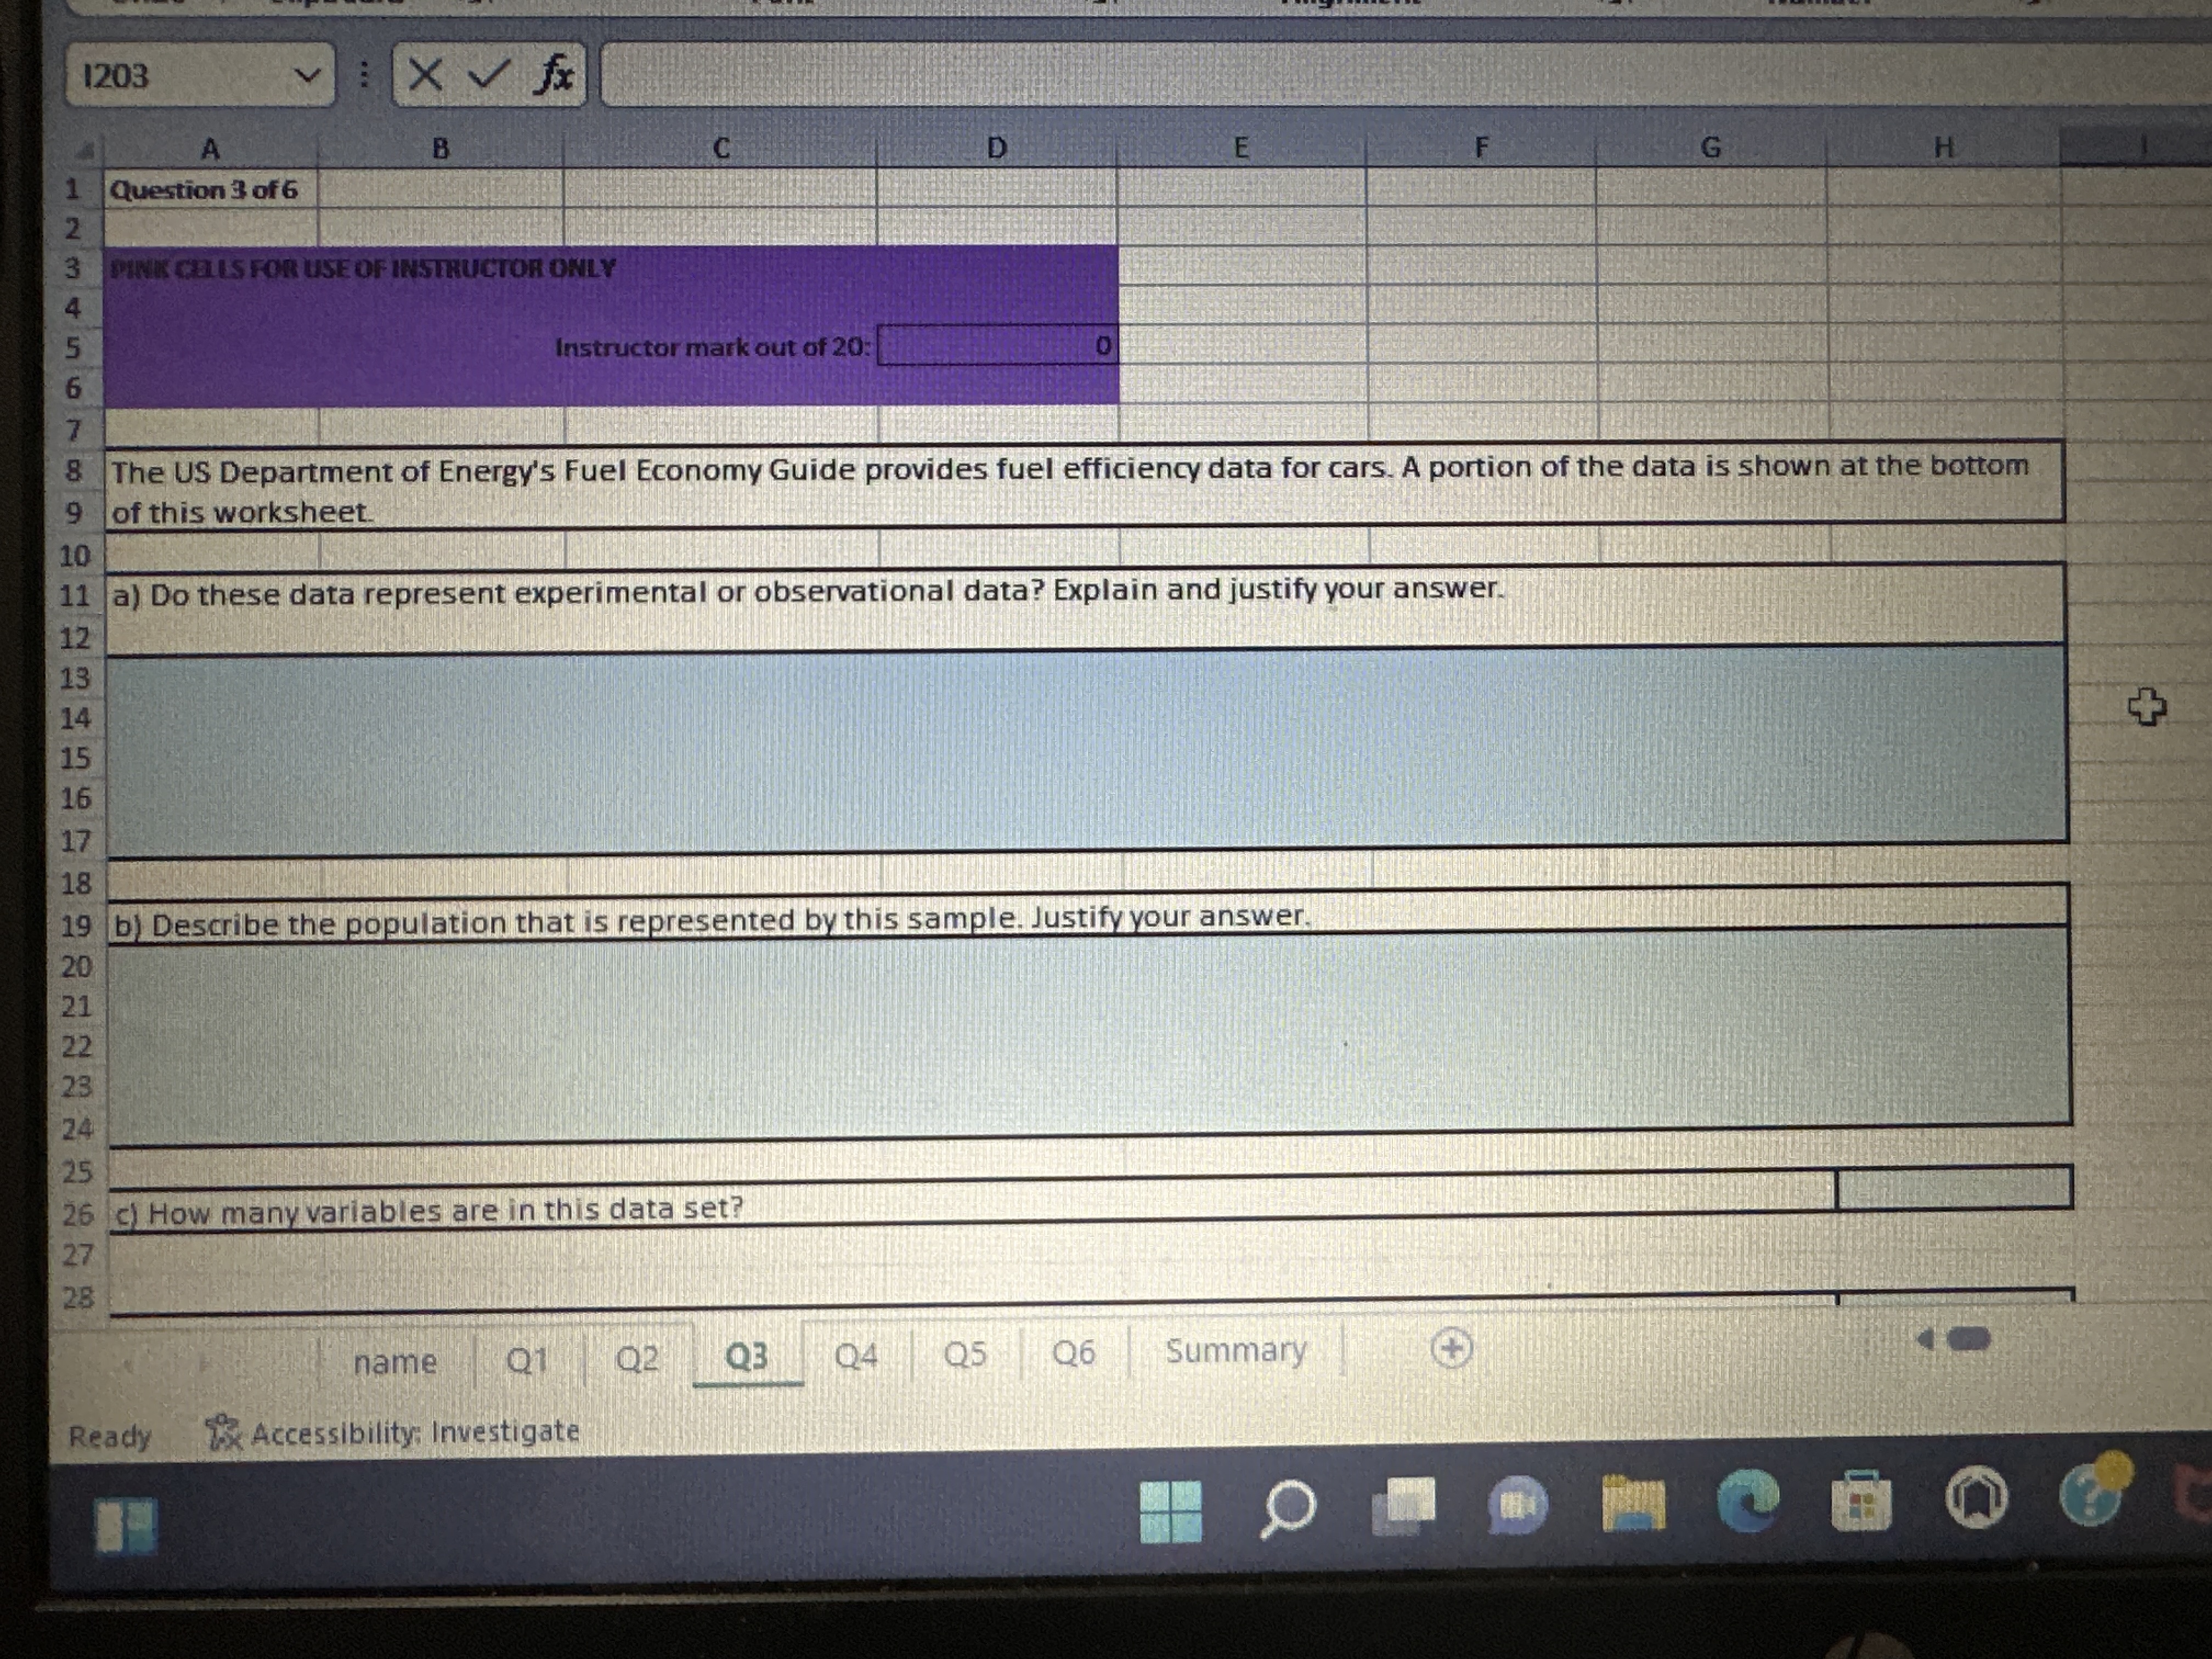
Formatting " Table ~ Sty Undo Clipboard Font Alignment Number Styles 1203 XV fx C D G H 25 26 c) How many variables are in this data set? 27 28 29 d) How many data values are in this data set? 30 31 32 e) Make a scatter plot to show the relationship between "City MPG" and "Hwy MPG". Enter the cell number of the top left corner of the 33 graph. What is the covariance and correlation coefficient between "City MPG" and "Hwy MPG"? 34 35 cell number 36 37 covariance + 38 39 correlation coefficient 40 41 42 f) Which of the variable(s) are numerical? 43 44 45 46 Size (1=Compact, Cylinders Drive Fuel Type City MPG Hwy MPG Car Displacement 2=Midsize, 3-Large) 47 2.0 F P 22 30 Q4 Q6 Summary + name Q1 Q2 Q5 Ready x Accessibility: Investigate O npFormatting ~ Table ~ Styles ~ Format D Undo Clipboard Font Alignment Number Style Cells 1203 XV fx C G M 45 46 Size (1=Compact, Car Cylinders Drive Fuel Type City MPG Hwy MPG 2-Midsize, Displacement 3-Large) 47 48 2.0 P 22 30 49 2.0 21 29 50 20 21 31 51 3.0 18 28 3.0 18 27 6.0 12 19 1 4.4 16 4.4 3.6 3.6 3.6 6.2 6.2 2.4 1 3.6 2.0 2.0 2.0 2.0 1.8 58 1.8 24 59 Summary name Q1 Q2 03 04 Q5 Q6 Ready XX Accessibility. Investigate O1203 B C D G H A Question 3 of 6 PINK CELLS FOR USE OF INSTRUCTOR ONLY Instructor mark out of 20: The US Department of Energy's Fuel Economy Guide provides fuel efficiency data for cars. A portion of the data is shown at the bottom of this worksheet. 10 11 a) Do these data represent experimental or observational data? Explain and justify your answer. 12 13 + 14 15 16 17 18 19 b) Describe the population that is represented by this sample. Justify your answer. 20 21 22 23 24 25 26 c) How many variables are in this data set? 27 28 Summary name Q1 Q2 Q3 Q4 Q5 Q6 Ready TX Accessibility: Investigate
Step by Step Solution
There are 3 Steps involved in it

Get step-by-step solutions from verified subject matter experts