

Question: Formulate MILP for this problem and give all the variables, decision variables, constraints and objective function for the problem. also give an optimal solution Client
Formulate MILP for this problem and give all the variables, decision variables, constraints and objective function for the problem. also give an optimal solution
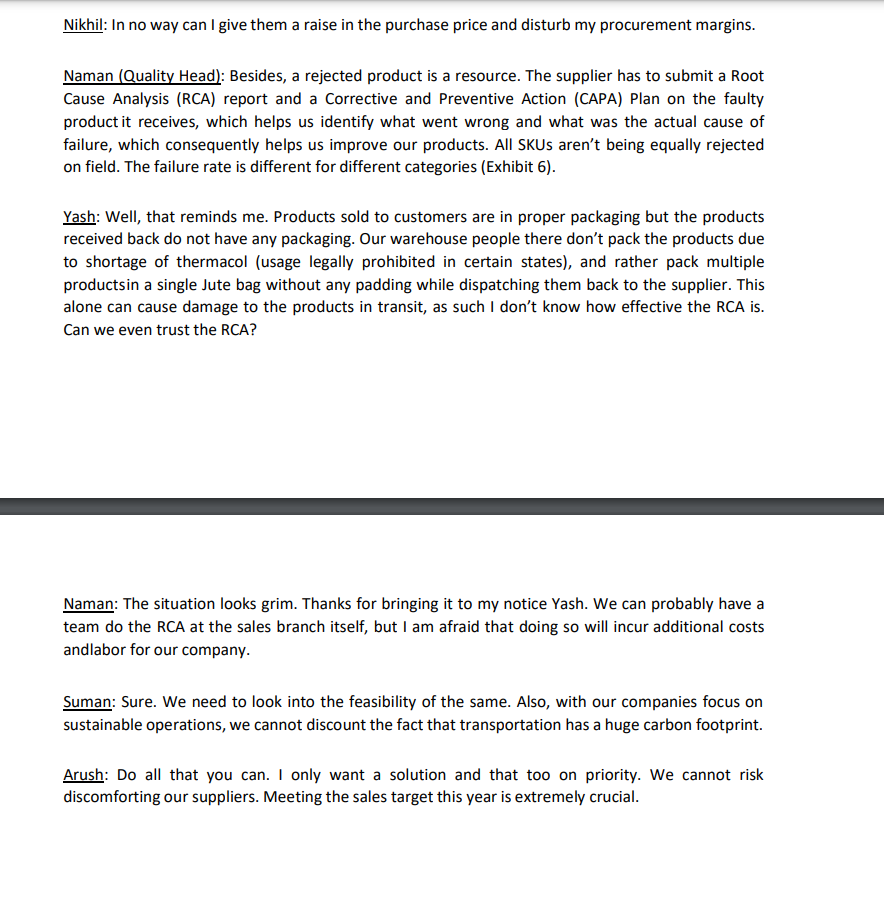
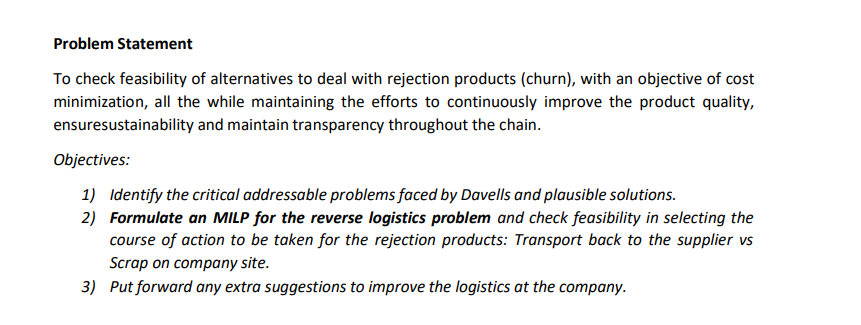
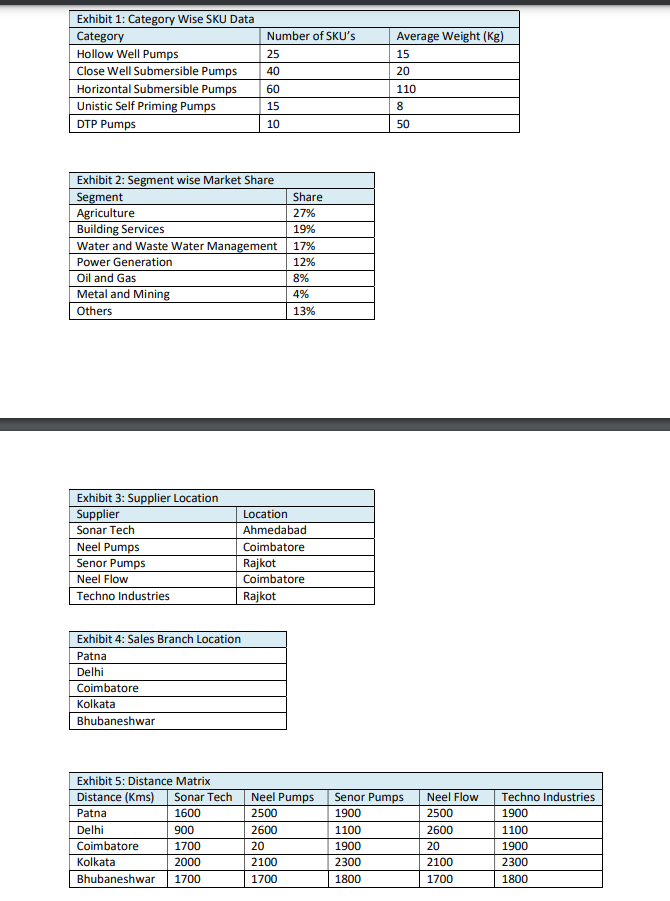
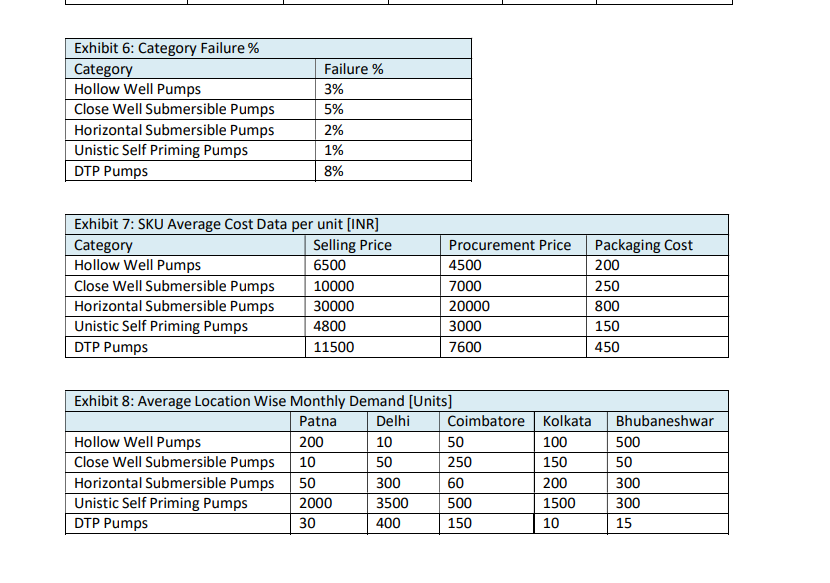
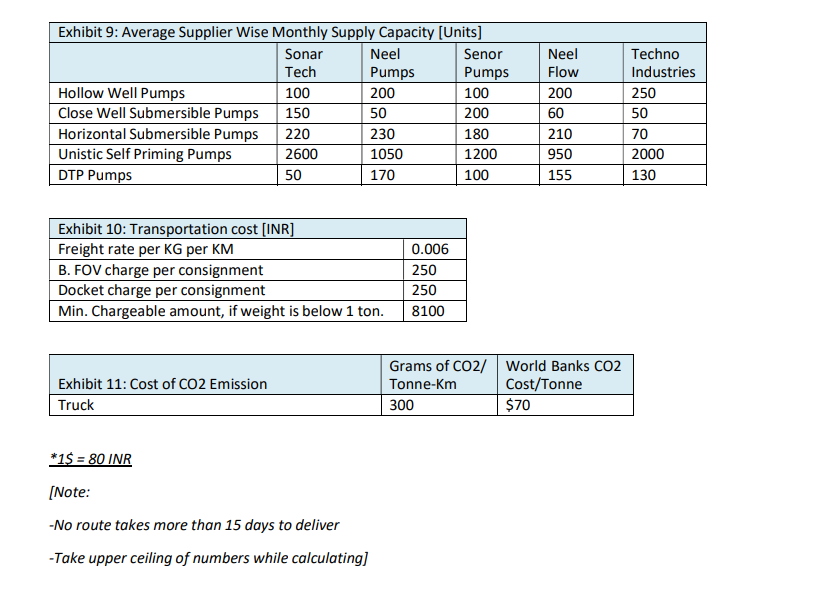
Client Background Davells Ltd, established in 1910, is a giant engineering conglomerate serving its global clientele with a diverse set of products in the Industrial and Consumer segment ranging from Transformers, Switch Gears, Motors to Ceiling Fans, Water Heaters etc. The company is headquartered in Goa, with its sales branches spread across India and abroad. Owing to a stagnant revenue growth, the company decided to venture into the Pump market. 1st January 2018, the company officially launched its pump product range into the market with 150 SKU's in multiple pump categories (Exhibit 1). Leveraging the existing brand presence, infrastructure and its strong distribution channels, the company was able tosecure a firm footing in the market within the first 2 years of its launch, clocking in an annual turnoverof around 100 crores. Despite the strong brand presence, this particular product line is still in its infancy with its immediate competitors raking in annual revenues of 1000+ crores. The Unistic market for pumps in India is worth 8500 crores with the Agriculture and Building Services comprising 46% of the total market value while the Industrial Sector comprising the remaining 54% (Exhibit 2). With the GDP targets for India being fuelled primarily by growth in urban infrastructure, analysts predict the pump market in India to grow steadily with a CAGR of 12%, and Davells, with its focus on digitalization to increase its operational efficiency, is investing heavily to capture a significant market share in this particular product line by catapulting its revenue to a targeted figure of 250 crores by theend of 2023 . Business Operations The entire pump production of Davells is outsourced. The company follows a contract manufacturing strategy by tying up with suppliers across the country and getting a finished product made, conforming to the company's quality standards. Suppliers deliver the product directly to its sales branch warehouses, with the company brand packaging, from where it is later billed to the end customer i.e. The dealers or the retailers. The Company has 5 suppliers across India (Exhibit 3) and 5 sales branches across India (Exhibit 4). At the start of every month, the head office collects a demand forecast of all SKU's from the sales branches, allocates the SKU's to the suppliers manufacturing them and issues the respective purchase orders to the suppliers to be fulfilled by the end of the month. The suppliers then dispatch the products on door delivery basis (Inco terms DDP) to the respective branches. The Procurement department handles the procurement of these products from the suppliers which are then sold by the sales branches with a markup. An integral part of the entire supply chain is the reverse logistics. Whenever a product under warranty is rejected on field due to manufacturing discrepancies, it is replaced at the sales branches and a new product is given to the customer in exchange of the dysfunctional one. The dysfunctional unit is then dispatched back to the supplier (Inco terms DDP), who examines and submits a root cause analysis report to the Head Office before scraping it. The product should be dispatched and delivered back to the supplier within 45 days as per regulation and the suppliers account is debited a 100% of the rejected product value. Scrap value is 30% of the purchase price of sales branches. Problem It has been noted that the company is facing issues in order allocation to suppliers, besides, the reverse supply chain of products is also not functioning optimally and this has led to a tussle between the procurement team at the Head office, and the suppliers: on whom the entire product supply and consequently the sales target is dependent on. The issue is noted in the head office. Following is a snippet of the conversation. Arush (General Manager): It has been brought to my notice that the suppliers are being wrongly debited which has caused them discomfort and they have threatened to hold up our supplies. Is that true? If it is, then let me make it very clear that we cannot afford to miss our annual sales target and with 100% of our products being outsourced, we in no way can afford to dissatisfy our suppliers. Nikhil (Procurement Head): Let me explain Arush. The supplier accounts getting debited might seema little erratic but I have gone through the records and the debits are for the products rejected underwarranty. Arush: But in that case, should the supplier not be knowing about the cause of the debits? Does he not have the product with him? I am unable to understand the issue, Nikhil. Nikhil: Well, you are right Arush there have been certain issues with our reverse supply chain operations. I am afraid the suppliers have not received the products back. Arush: At least tell me that they have been informed that the product that they've made has been rejected on field. Nikhil: I am afraid Arush but we do not have any such system in place yet. When the productrejected on field is replaced at the sales branches, automatically the suppliers account gets debited for 100% purchase value of that product through our ERP software and an Invoice is generated over which the product is later dispatched back to the supplier and the supplier gets the Invoice along withthe rejected product for his record. Arush: That is fine, but even in that case we are legally obliged to deliver the rejected products back to our suppliers within 45 days. Even the journey between our Northernmost branch to our Southernmost supplier takes less than 45 days, as such I don't understand why the supplier should not receive his products? Nikhil: Yash, please shed some light on this. Yash (Procurement Executive): Sir I have been in discussions with the sales branch warehouses over the same issue. What they have brought to my notice is that the Incoming material load is huge with each vehicle carrying 9-24 Tonnes of products which makes the per unit shipping cheaper for the supplier, but the rejected products are few. Only on average of around 4% of the incoming lot, and thus to transport these products back to the supplier incurs higher per unit costs to the sales branches, which our sales branches are not ready to incur. Consequently, the warehouse team waits till a sizeable number of rejected products are accumulated and then dispatches them in one single go. Thisaccumulation takes time and as a result the rejected products and its intimation reaches the supplier long after 45 days. Arush: That is ridiculous. How can we expect the suppliers to support us if we are not taking care of their belongings? Can we expedite the dispatches, Suman? Suman (Sales Head): Arush, I don't think we can do that. I have already had a word with our warehouse managers. They are reluctant, and besides their justification for our company not having to bear any extra costs, does make sense. I suggested Nikhil an alternative. Once the rejected products are received at our sales branches, we will scrap them there itself as such no reverse transportation will be required. As for the suppliers, Nikhil can give them an additional 5% increase on the purchase price as a rejection allowance. Nikhil: In no way can I give them a raise in the purchase price and disturb my procurement margins. Naman (Quality Head): Besides, a rejected product is a resource. The supplier has to submit a Root Cause Analysis (RCA) report and a Corrective and Preventive Action (CAPA) Plan on the faulty product it receives, which helps us identify what went wrong and what was the actual cause of failure, which consequently helps us improve our products. All SKUs aren't being equally rejected on field. The failure rate is different for different categories (Exhibit 6). Yash: Well, that reminds me. Products sold to customers are in proper packaging but the products received back do not have any packaging. Our warehouse people there don't pack the products due to shortage of thermacol (usage legally prohibited in certain states), and rather pack multiple productsin a single Jute bag without any padding while dispatching them back to the supplier. This alone can cause damage to the products in transit, as such I don't know how effective the RCA is. Can we even trust the RCA? Naman: The situation looks grim. Thanks for bringing it to my notice Yash. We can probably have a team do the RCA at the sales branch itself, but I am afraid that doing so will incur additional costs andlabor for our company. Suman: Sure. We need to look into the feasibility of the same. Also, with our companies focus on sustainable operations, we cannot discount the fact that transportation has a huge carbon footprint. Arush: Do all that you can. I only want a solution and that too on priority. We cannot risk discomforting our suppliers. Meeting the sales target this year is extremely crucial. Problem Statement To check feasibility of alternatives to deal with rejection products (churn), with an objective of cost minimization, all the while maintaining the efforts to continuously improve the product quality, ensuresustainability and maintain transparency throughout the chain. Objectives: 1) Identify the critical addressable problems faced by Davells and plausible solutions. 2) Formulate an MILP for the reverse logistics problem and check feasibility in selecting the course of action to be taken for the rejection products: Transport back to the supplier vs Scrap on company site. 3) Put forward any extra suggestions to improve the logistics at the company. \begin{tabular}{|l|l|l|} \hline \multicolumn{2}{|l|}{ Exhibit 1: Category Wise SKU Data } \\ \hline Category & Number of SKU's & Average Weight (Kg) \\ \hline Hollow Well Pumps & 25 & 15 \\ \hline Close Well Submersible Pumps & 40 & 20 \\ \hline Horizontal Submersible Pumps & 60 & 110 \\ \hline Unistic Self Priming Pumps & 15 & 8 \\ \hline DTP Pumps & 10 & 50 \\ \hline \end{tabular} \begin{tabular}{|l|l|} \hline \multicolumn{2}{|l|}{ Exhibit 2: Segment wise Market Share } \\ \hline Segment & Share \\ \hline Agriculture & 27% \\ \hline Building Services & 19% \\ \hline Water and Waste Water Management & 17% \\ \hline Power Generation & 12% \\ \hline Oil and Gas & 8% \\ \hline Metal and Mining & 4% \\ \hline Others & 13% \\ \hline \end{tabular} \begin{tabular}{|l|l|} \hline Exhibit 3: Supplier Location \\ \hline Supplier & Location \\ \hline Sonar Tech & Ahmedabad \\ \hline Neel Pumps & Coimbatore \\ \hline Senor Pumps & Rajkot \\ \hline Neel Flow & Coimbatore \\ \hline Techno Industries & Rajkot \\ \hline \end{tabular} \begin{tabular}{|l|} \hline Exhibit 4: Sales Branch Location \\ \hline Patna \\ \hline Delhi \\ \hline Coimbatore \\ \hline Kolkata \\ \hline Bhubaneshwar \\ \hline \end{tabular} \begin{tabular}{|l|l|l|l|l|l|} \hline \multicolumn{6}{|l|}{ Exhibit 5: Distance Matrix } \\ \hline Distance (Kms) & Sonar Tech & Neel Pumps & Senor Pumps & Neel Flow & Techno Industries \\ \hline Patna & 1600 & 2500 & 1900 & 2500 & 1900 \\ \hline Delhi & 900 & 2600 & 1100 & 2600 & 1100 \\ \hline Coimbatore & 1700 & 20 & 1900 & 20 & 1900 \\ \hline Kolkata & 2000 & 2100 & 2300 & 2100 & 2300 \\ \hline Bhubaneshwar & 1700 & 1700 & 1800 & 1700 & 1800 \\ \hline \end{tabular} \begin{tabular}{|l|l|} \hline \multicolumn{2}{|l|}{ Exhibit 6: Category Failure \% } \\ \hline Category & Failure \% \\ \hline Hollow Well Pumps & 3% \\ \hline Close Well Submersible Pumps & 5% \\ \hline Horizontal Submersible Pumps & 2% \\ \hline Unistic Self Priming Pumps & 1% \\ \hline DTP Pumps & 8% \\ \hline \end{tabular} \begin{tabular}{|l|l|l|l|} \hline \multicolumn{5}{|l|}{ Exhibit 7: SKU Average Cost Data per unit [INR] } \\ \hline Category & Selling Price & Procurement Price & Packaging Cost \\ \hline Hollow Well Pumps & 6500 & 4500 & 200 \\ \hline Close Well Submersible Pumps & 10000 & 7000 & 250 \\ \hline Horizontal Submersible Pumps & 30000 & 20000 & 800 \\ \hline Unistic Self Priming Pumps & 4800 & 3000 & 150 \\ \hline DTP Pumps & 11500 & 7600 & 450 \\ \hline \end{tabular} \begin{tabular}{|l|l|l|l|l|l|} \hline Exhibit 8: Average Location Wise Monthly Demand [Units] \\ \hline & Patna & Delhi & Coimbatore & Kolkata & Bhubaneshwar \\ \hline Hollow Well Pumps & 200 & 10 & 50 & 100 & 500 \\ \hline Close Well Submersible Pumps & 10 & 50 & 250 & 150 & 50 \\ \hline Horizontal Submersible Pumps & 50 & 300 & 60 & 200 & 300 \\ \hline Unistic Self Priming Pumps & 2000 & 3500 & 500 & 1500 & 300 \\ \hline DTP Pumps & 30 & 400 & 150 & 10 & 15 \\ \hline \end{tabular} *1S =80INR [Note: -No route takes more than 15 days to deliver -Take upper ceiling of numbers while calculating]
Step by Step Solution
There are 3 Steps involved in it

Get step-by-step solutions from verified subject matter experts