

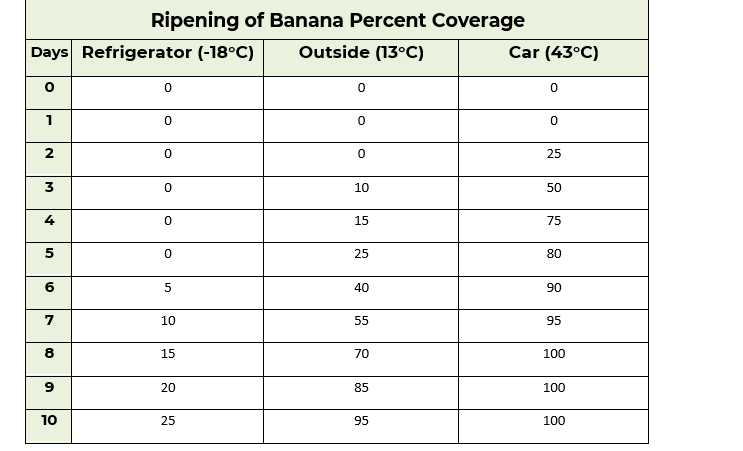
Question: fPart 2: Using your data in Part 1, create a graph representing each banana's ripening percent coverage over the ten days. Unless Otherwise Moted All
Step by Step Solution
There are 3 Steps involved in it
1 Expert Approved Answer
Step: 1 Unlock

Question Has Been Solved by an Expert!
Get step-by-step solutions from verified subject matter experts
Step: 2 Unlock
Step: 3 Unlock