

Question: fPart A: Visualization 1. Plot the series using a line chart. Briey describe what you see: Is it a positive or negative trend? Is the
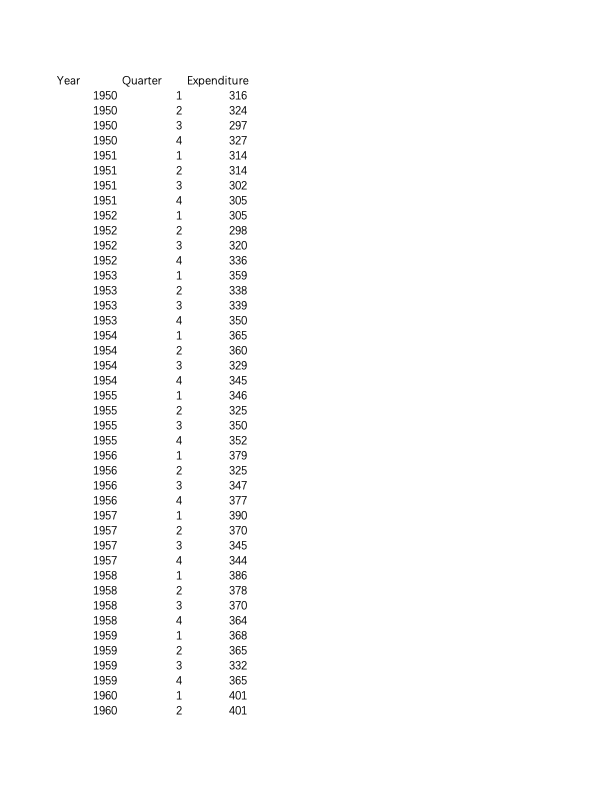


\fPart A: Visualization 1. Plot the series using a line chart. Briey describe what you see: Is it a positive or negative trend? Is the trend increasing? What kind of short term uctuations do you observe? 2. Answer the previous question using the log-scale. Can you tell if the growth rate is increasing or decreasing on average over the period? 3. To better see how the growth rate evolves through time, plot the annualized growth rate of consumption expenditure. Describe what you see. Is it constant on average? Part B: Time Series Decomposition 1. Fit a linear and quadratic trends to your series. Then, create a line chart with your original series and the two trends. Which trend seems to best t the series? Explain. 2. Fit a linear and quadratic trends to the log of your series. Then, create a line chart with the log of your series and the two trends. Which trend seems to best t the series? Do you see a difference between the best trend in this question and in the previous one? Explain. Answer the following questions using the log of your series and the trends computed in question 2. 3. Plot the detrended series using the trend that best t the series. Briey describe what you see: Do you better detect short term uctuations? 4. Using a moving average of order 5, compute the cyclical component of your series. Then, plot the cycle and briey describe what you see: interpret the values of some peaks and troughs. 5. Plot the low frequency of your series and briey describe what you see. 6. Compute the seasonal component and represent it on a bar chart (only the 4 quarters). Interpret the four seasonal values. Part C: Comovement For this part, select any other series in the le assignmentl.zip and answer the following questions: 0 Create a scatter plot of your series expressed in logs against the selected series also expressed in logs. 0 Using the log of the selected series, compute its cyclical component. Then create a scatter plot of this cycle with the cycle of your series computed in Part B. 0 Looking at the two scatter plots, what can you say about the type of eomovement between the two series
Step by Step Solution
There are 3 Steps involved in it

Get step-by-step solutions from verified subject matter experts