

Question: fQ. 2. Using MS Excel and the data given in the case: a. Create a histogram of the weekly operating profits from the prior year
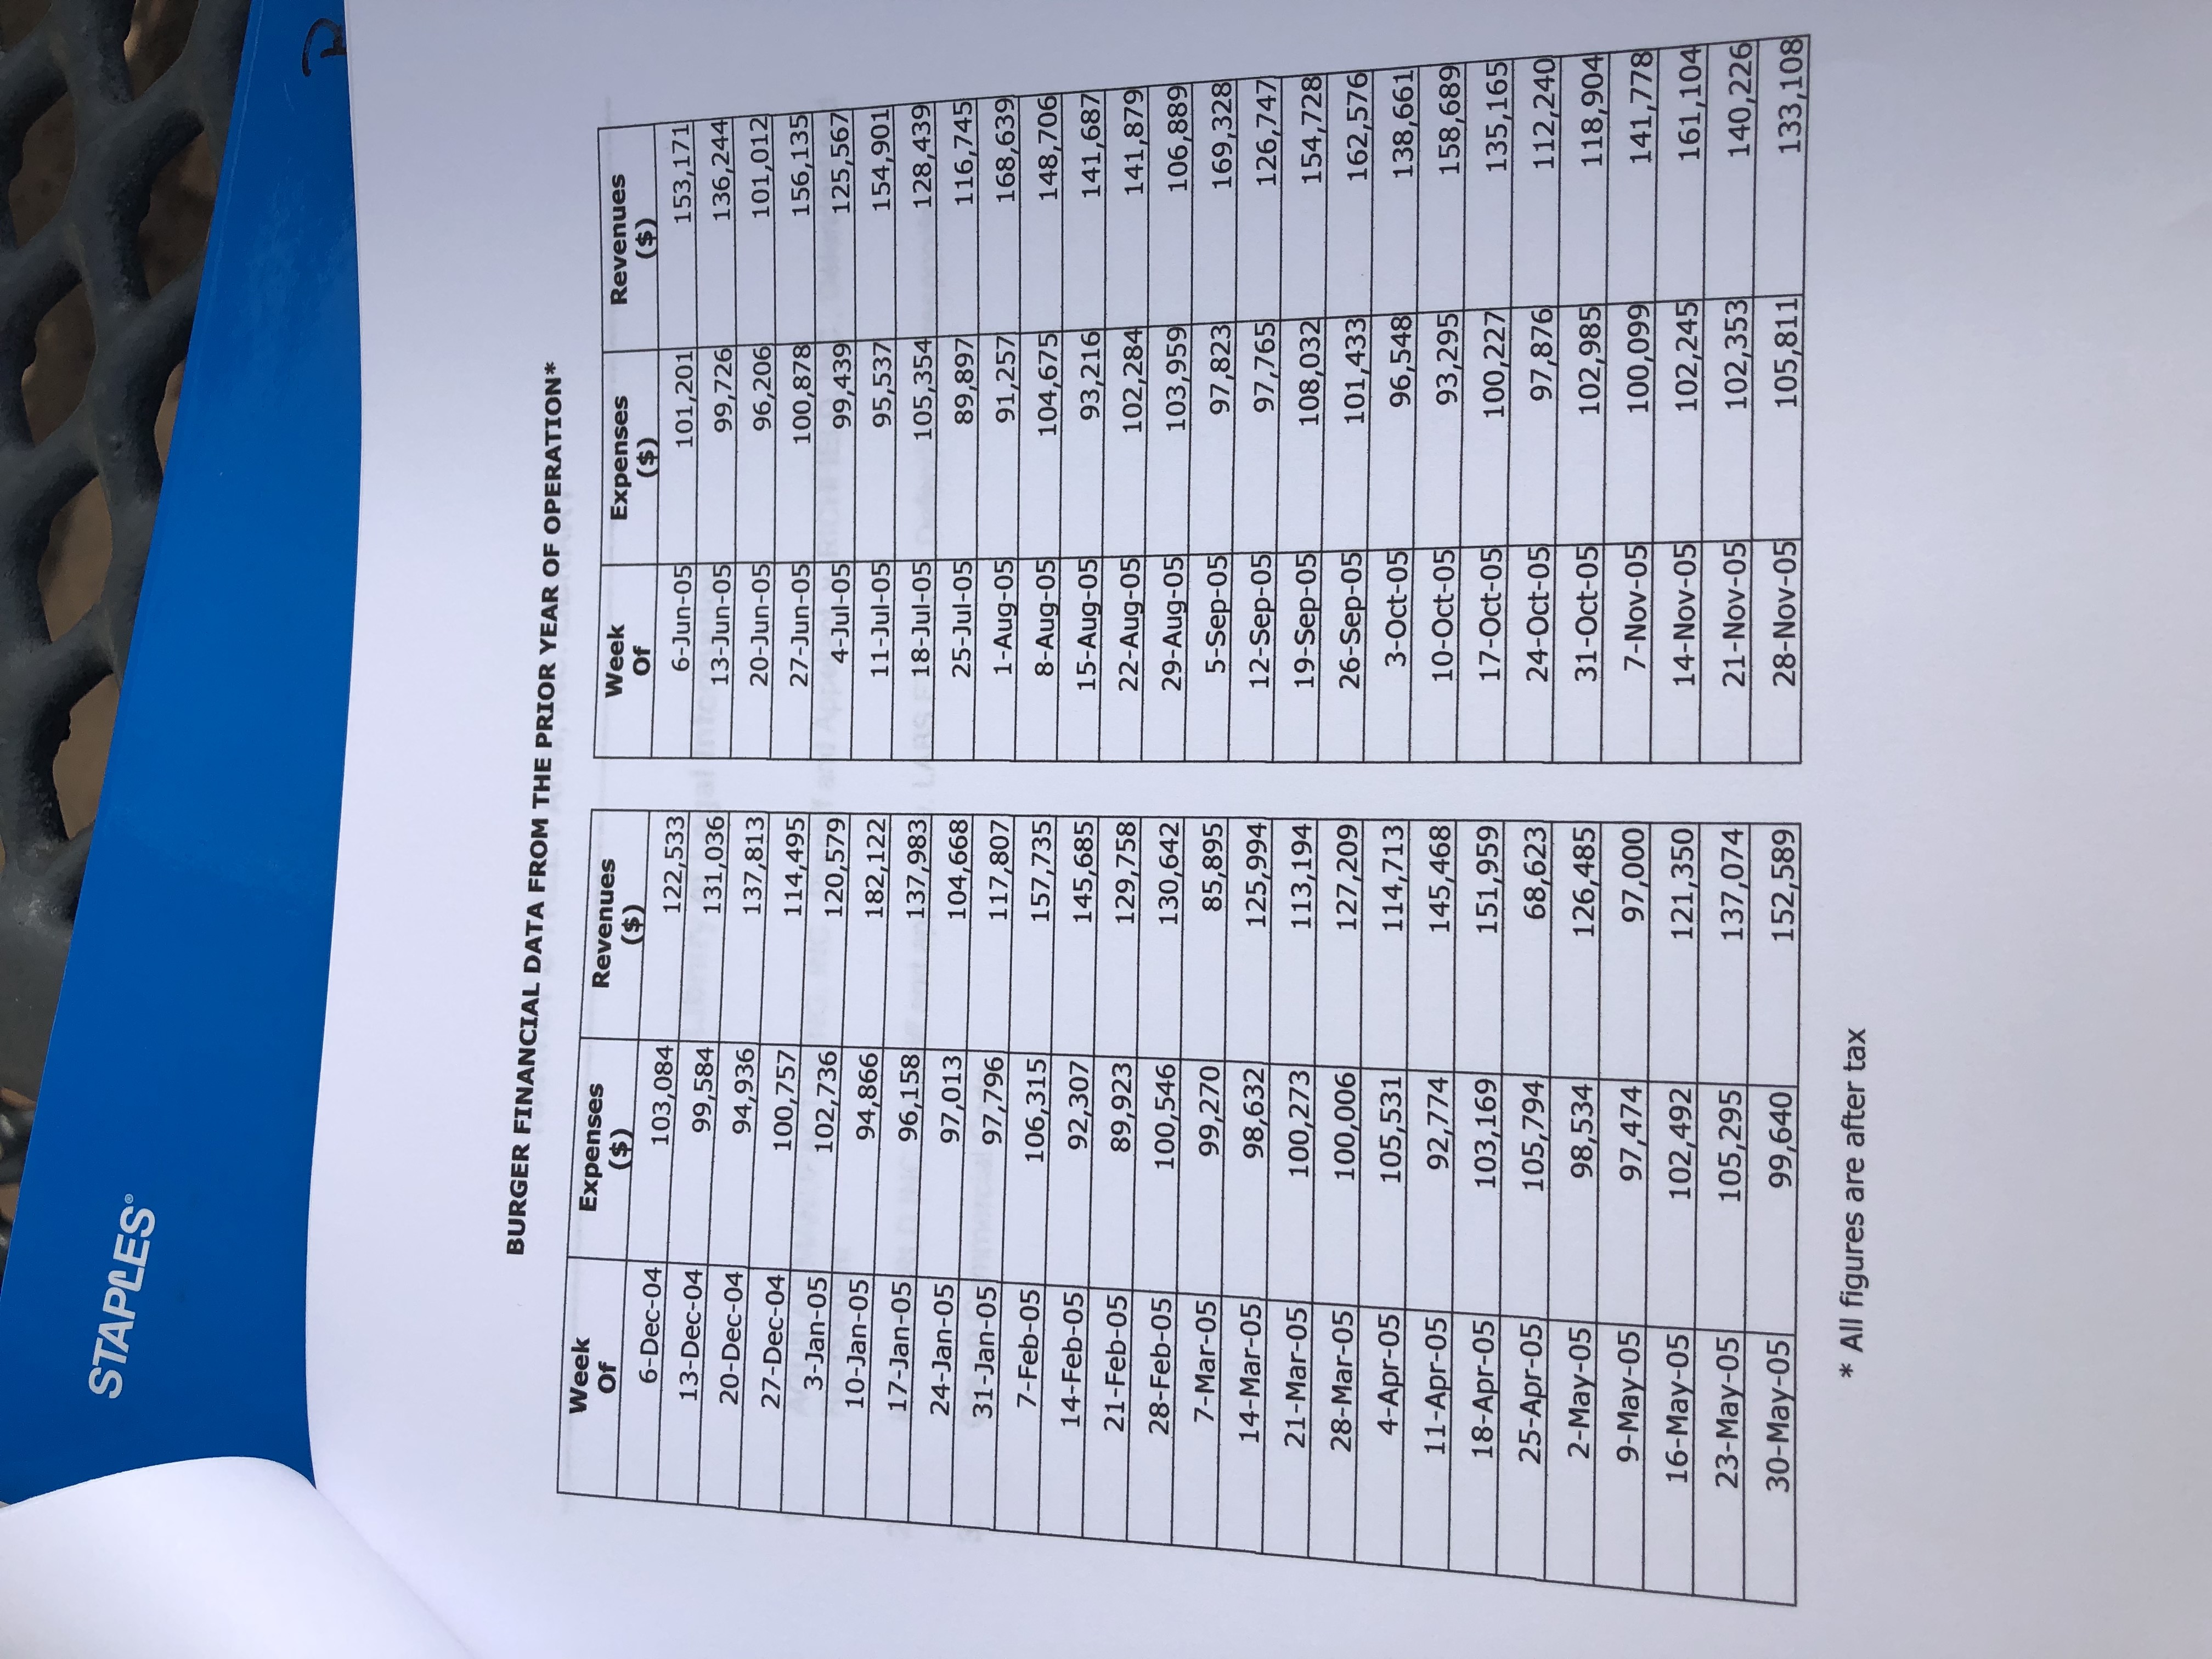
\fQ. 2. Using MS Excel and the data given in the case: a. Create a histogram of the weekly operating profits from the prior year of operation, using 6 equal sized bins. What is the mode on the histogram? How would you define it? Which probability distribution does the histogram resemble? (You may wish to use the Excel file Harvey's Case.x/s at the Gateway web site.) b. What was the average weekly profit for the prior 12-month period? Determine and define the variance and standard deviation of weekly profit. c. How confident are you of this estimate? Calculate a 99% confidence interval for weekly profits, assuming that sigma is unknown. What does this tell you about weekly profits? d. Based on the above, what is the expected exposure on the lost profits claim
Step by Step Solution
There are 3 Steps involved in it

Get step-by-step solutions from verified subject matter experts