

Question: fQ9. Examine Figure 3. Comment on the relationship between age, sex and height. Compare this plot with Figure 1, which we examined previously. How might
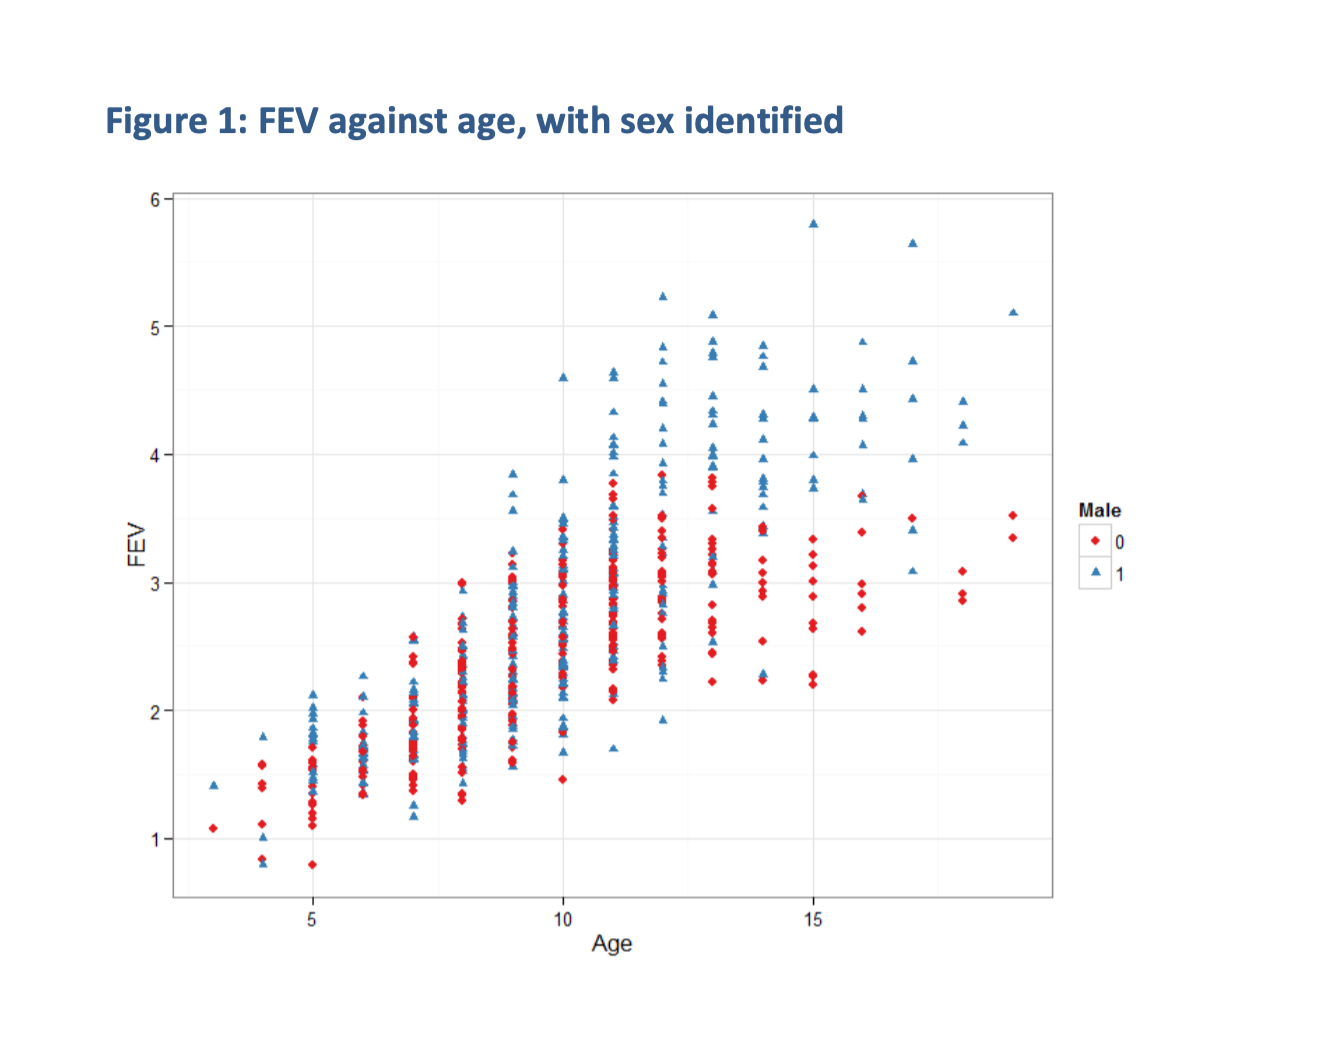
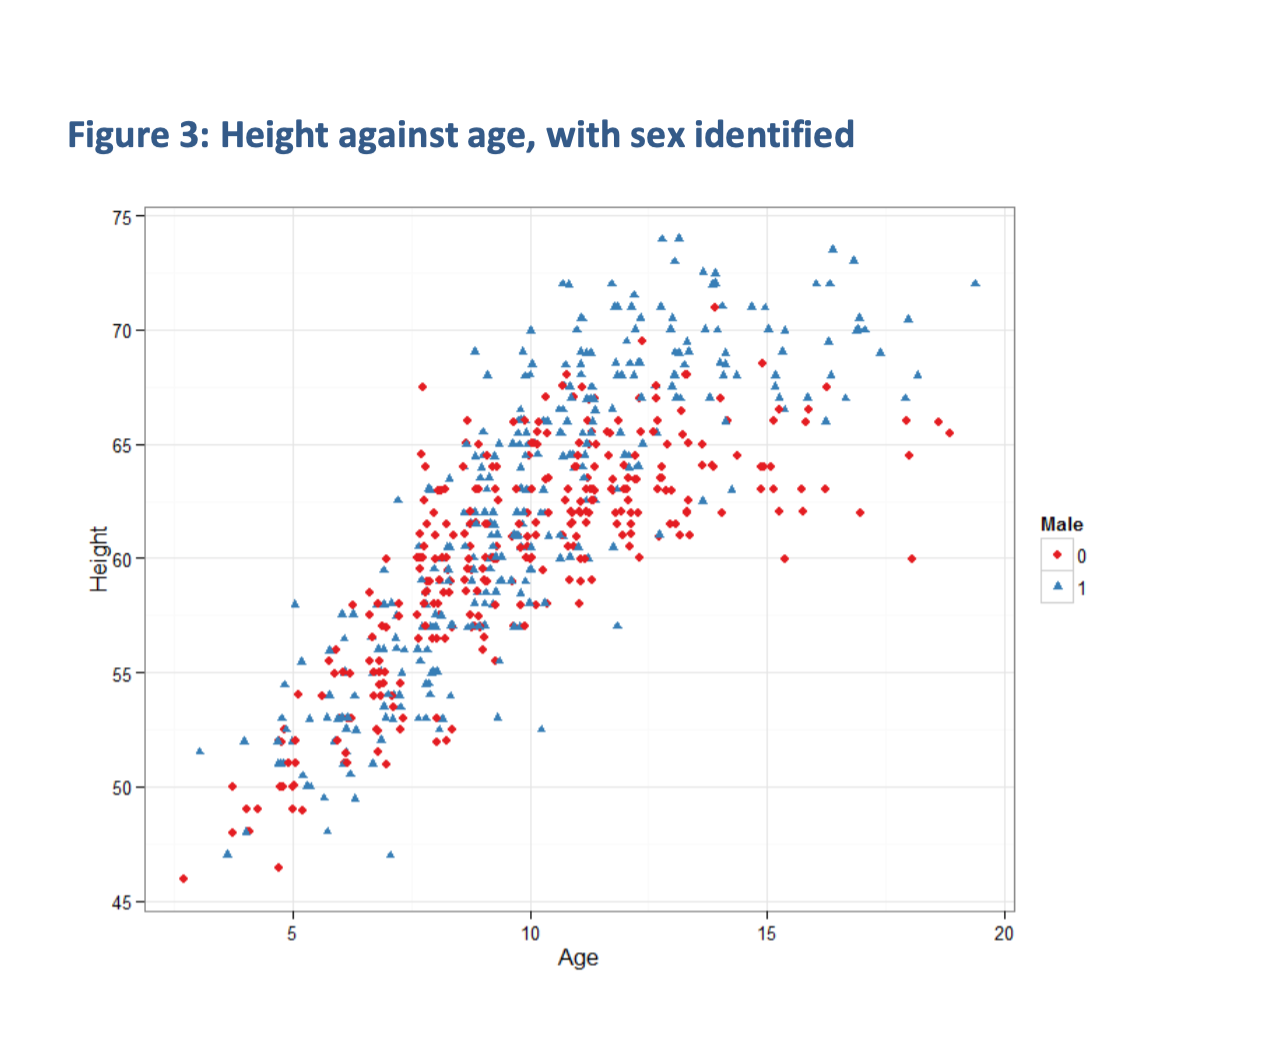
\fQ9. Examine Figure 3. Comment on the relationship between age, sex and height. Compare this plot with Figure 1, which we examined previously. How might these results impact how you interpret the relationship between age and FEV? Hint: think about what we know about human growth during puberty. Figure 3: Height against age, with sex identified 75- 70 65- Male Height 60 10 55 50 45 - UI - 10 15 20 Age
Step by Step Solution
There are 3 Steps involved in it
1 Expert Approved Answer
Step: 1 Unlock

Question Has Been Solved by an Expert!
Get step-by-step solutions from verified subject matter experts
Step: 2 Unlock
Step: 3 Unlock