

Question: fQUESTION 3 Questions #3-8: Create a correlation table using the Data Analysis function in Excel including the following variables: Amount purchased, Frequency, Last purchase, First
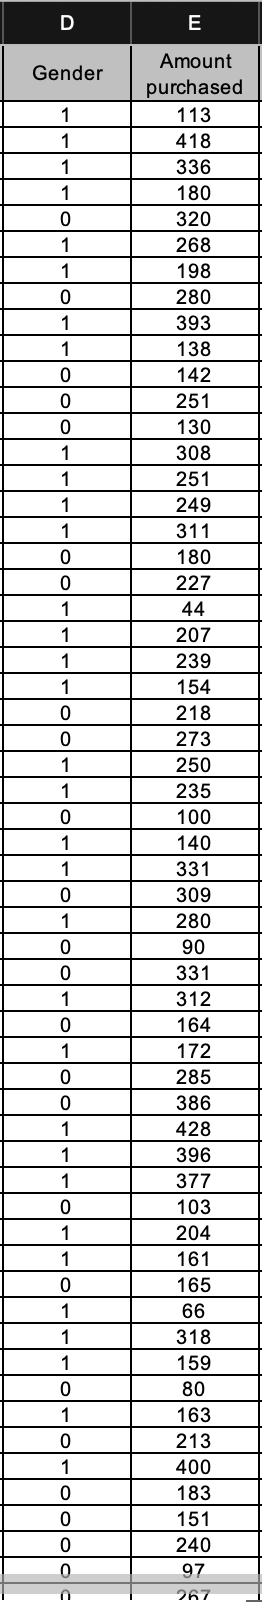
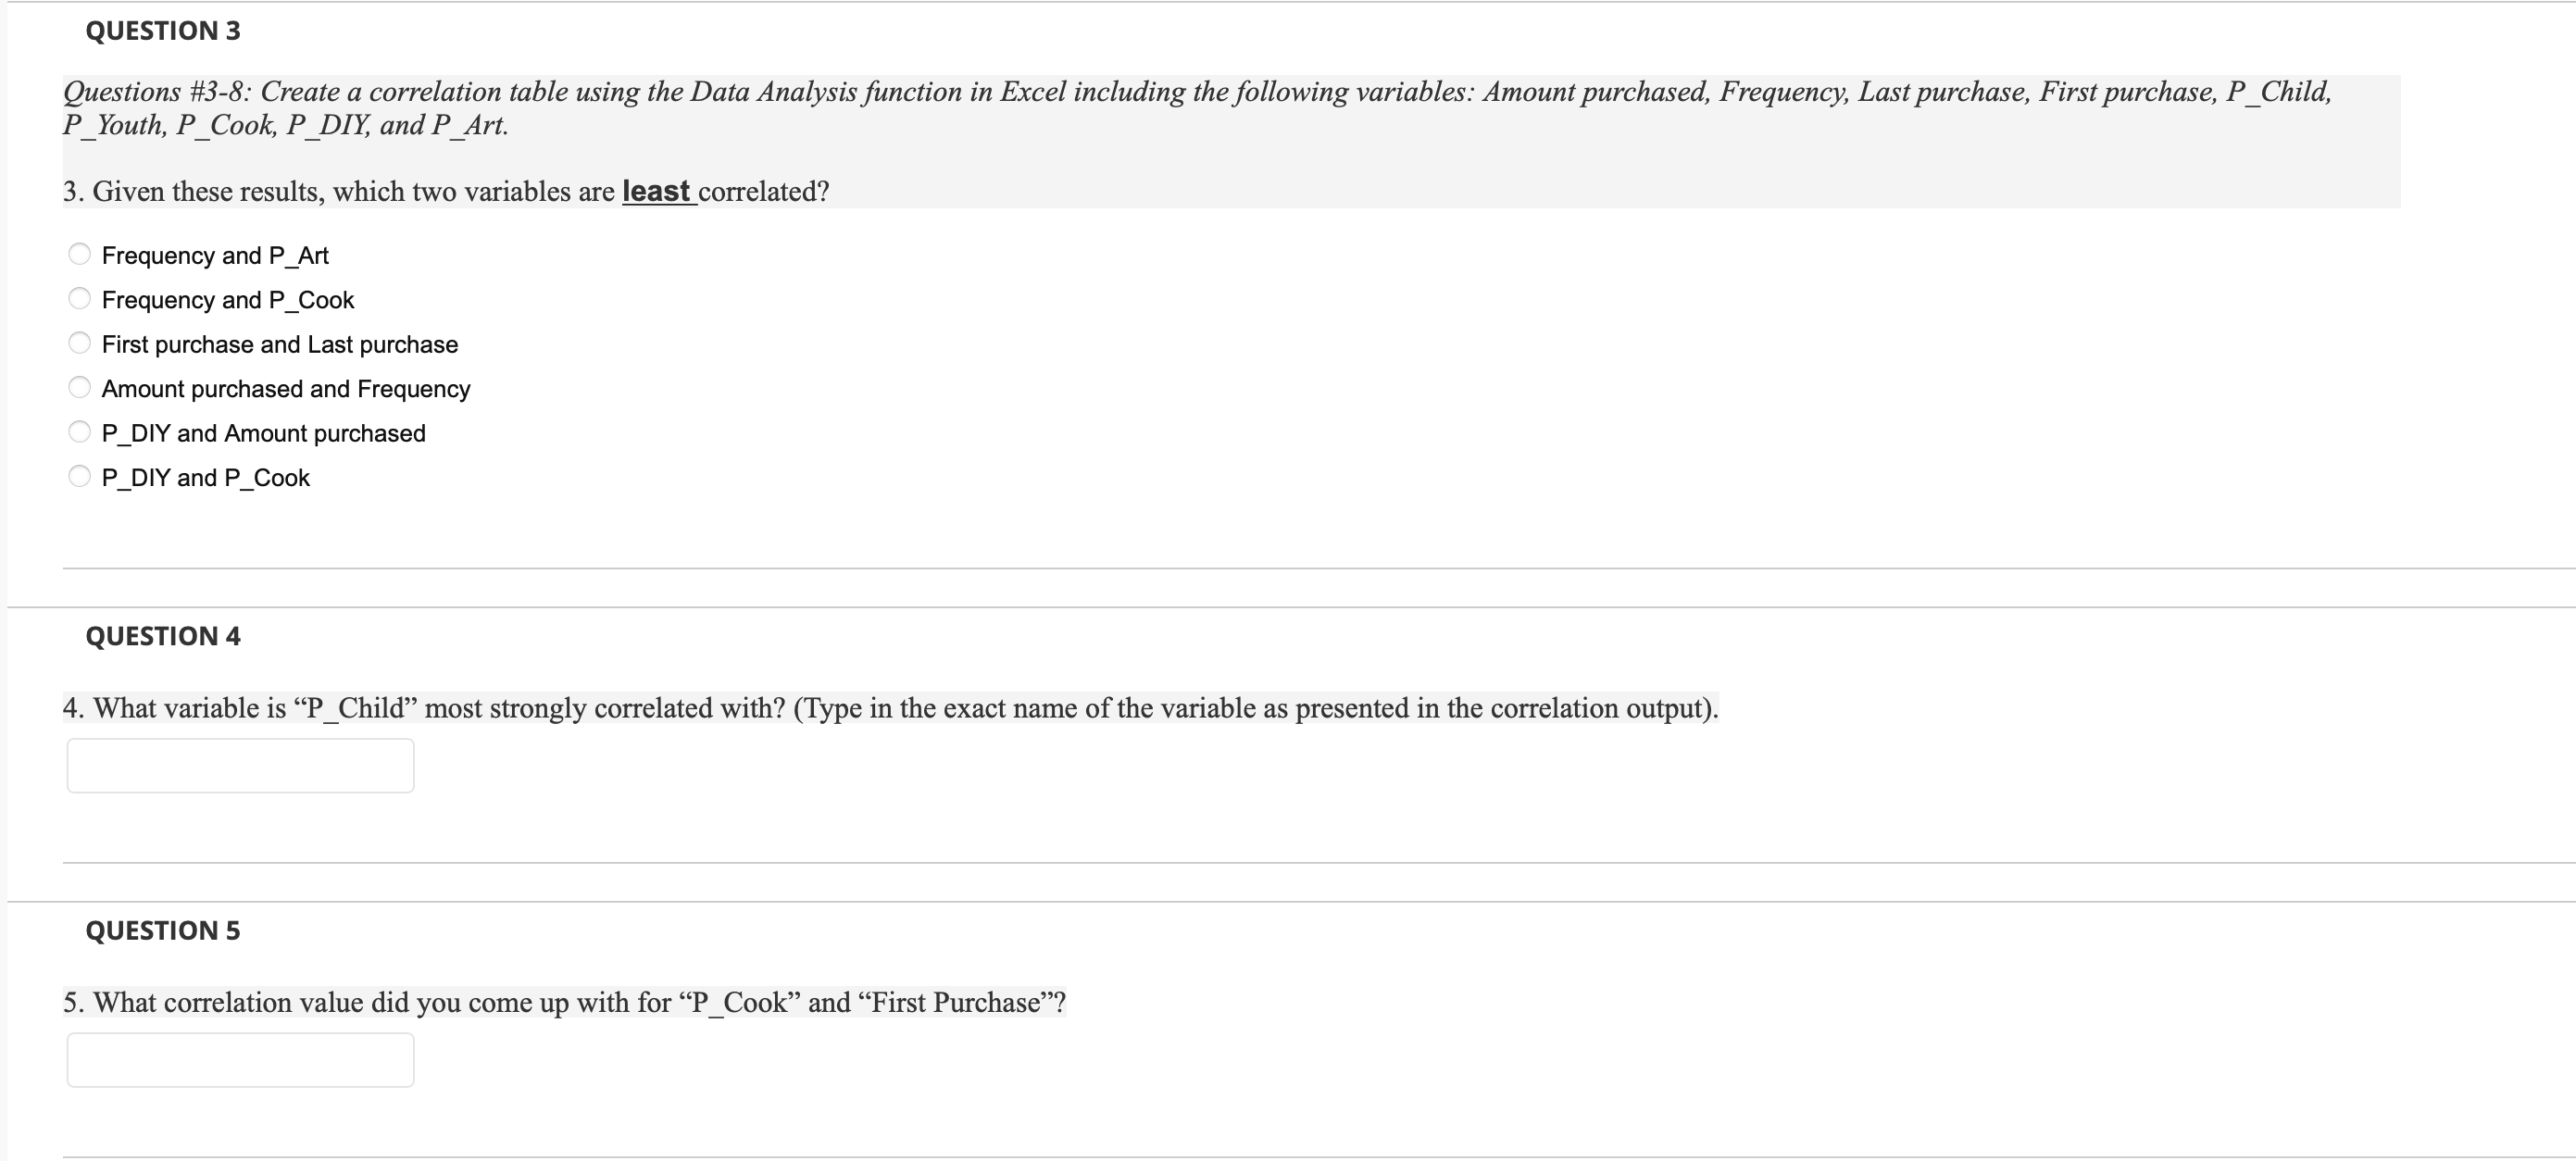
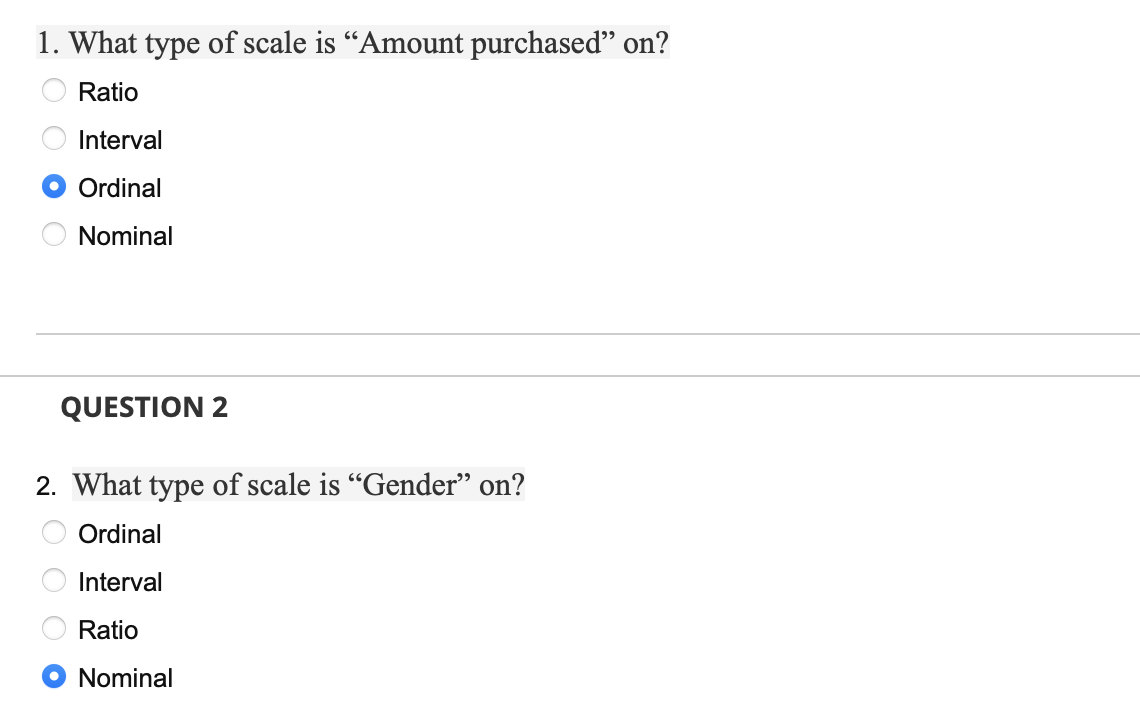
\fQUESTION 3 Questions #3-8: Create a correlation table using the Data Analysis function in Excel including the following variables: Amount purchased, Frequency, Last purchase, First purchase, P_Child, P_Youth, P_Cook, P_DIY, and P_Art. 3. Given these results, which two variables are least correlated? O Frequency and P_Art Frequency and P_Cook First purchase and Last purchase Amount purchased and Frequency O P_DIY and Amount purchased O P_DIY and P_Cook QUESTION 4 4. What variable is "P_Child" most strongly correlated with? (Type in the exact name of the variable as presented in the correlation output). QUESTION 5 5. What correlation value did you come up with for "P_Cook" and "First Purchase"?1. What type of scale is \"Amount purchased\" on? Ratio Interval O Ordinal Nominal QUESTION 2 2. What type of scale is \"Gender\" on? Ordinal Interval Ratio 0 Nominal
Step by Step Solution
There are 3 Steps involved in it

Get step-by-step solutions from verified subject matter experts