

Fred pressed the 'retum' key, carrying out the trades he had figured would give him a...
Fantastic news! We've Found the answer you've been seeking!
Question:

Transcribed Image Text:
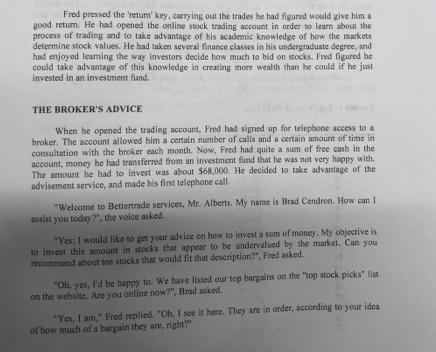
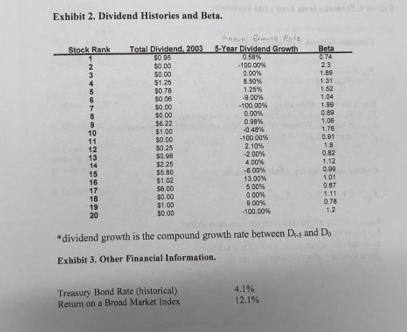
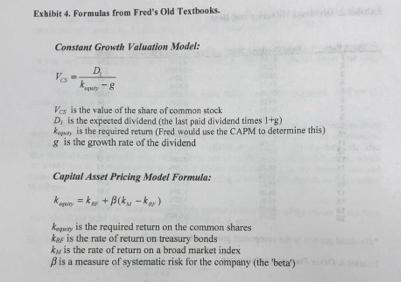
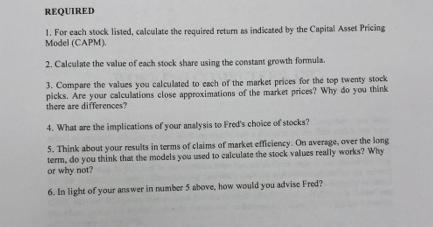
Fred pressed the 'retum' key, carrying out the trades he had figured would give him a good return. He had opened the online stock trading account in order to learn about the process of trading and to take advantage of his academic knowledge of how the markets determine stock values. He had taken several finance classes in his undergraduate degree, and had enjoyed learning the way investors decide how much to bid on stocks. Fred figured he could take advantage of this knowledge in creating more wealth than he could if he just invested in an investment fund. THE BROKER'S ADVICE When he opened the trading account, Fred had signed up for telephone access to a broker. The account allowed him a certain number of calls and a certain amount of time in consultation with the broker each month. Now, Fred had quite a sum of free cash in the account, money he had transferred from an investment fund that he was not very happy with. The amount he had to invest was about $68,000. He decided to take advantage of the advisement service, and made his first telephone call. "Welcome to Bettertrade services, Mr. Alberts. My name is Brad Cendron. How can I assist you today?", the voice asked. "Yes; I would like to get your advice on how to invest a sum of money. My objective is to invest this amount in stocks that appear to be undervalued by the market. Can you recommend about ten stocks that would fit that description?", Fred asked. "Oh, yes, I'd be happy to. We have listed our top bargains on the top stock picks" list on the website. Are you online now?", Brad asked. "Yes, I am," Fred replied. "Oh, I see it here. They are in order, according to your idea. of how much of a bargain they are, right?" "That's correct, Mr. Albert. We believe that these 20 stocks are going to have greater upside potential over time. I can help you make the transactions, if you'd like." "Well, I'm going to do a little more research on my own first, but thank you for the link. I'll just carry out transactions via the website, since the transaction fees are lower that way," Fred said. "OK. Mr. Albert, Brad replied. Let us know if you have other questions, or if we can assist you further." Fred printed out the list of stocks, and set about the task of collecting information about them. He went to the "market data" link on the company's website to get some information. For each firm, he downloaded the history of dividend payments, and the beta. He also downloaded current treasury bond rates and the rate of return on a broad market index, which he would use as an indicator of the market return. Fred summarized the information and prepared to determine the value of the stocks according to the financial models he had studied in college. Fred's collection of information and the current market prices of the stocks in the "top stock picks" list from his broker appear in Exhibits 1, 2, and 3. Exhibit 1. Top 20 Stock Picks List. Stock Rank 3 4 5 6 7 8 9 10 11 12 13 14 15 16 17 18 19 20 Price, 1/05/04 $14.89 529.02 $18.83 $93.48 $67.29 $3.28 $9.00 $55.91 $98.47 $43.07 $37 55 $38 30 $76.33 $57.09 $193.065 $38.33 $71.11 39:23 $19.36 $29.92 Exhibit 2. Dividend Histories and Beta. Stock Rank Total Dividend, 2003 $0.05 $0.00 $0.00 $1.25 $0.78 $0.00 $0.00 $0.00 56.22 $1.00 $0.00 $0.25 2 3 4 5 6 7 8 9 10 11 12 13 14 15 16 17 18 19 20 $0.08 $2.25 $5.80 $1.02 $8,00 $0.00 $1.00 $0.00 main with hole 5-Year Dividend Growth 0.58% -100.00% 0.00% 8.50% Treasury Bond Rate (historical) Return on a Broad Market Index 1.25% -9.00% -100.00% 0.00% 0.98% 0.48% -100.00% 2.10% -2.00% 4.00% -8.00% 13.00% 5.00% 0.00% 9:00% -100.00% Beta 0.74 23 1.89 1.31 1.52 4.1% 12.1% 1.04 1.99 0.89 1.06 1.76 0.91 18 0.82 1.12 0.00 101 *dividend growth is the compound growth rate between D, and D Exhibit 3. Other Financial Information. 0.87 1.11 0.78 1.2 Exhibit 4. Formulas from Fred's Old Textbooks. Constant Growth Valuation Model: D g Ves is the value of the share of common stock D, is the expected dividend (the last paid dividend times 1+g) Ky is the required return (Fred would use the CAPM to determine this) g is the growth rate of the dividend Capital Asset Pricing Model Formula: k=k+B(-k) Keity is the required return on the common shares kas is the rate of return on treasury bonds ky is the rate of return on a broad market index B is a measure of systematic risk for the company (the 'beta') REQUIRED 1. For each stock listed, calculate the required return as indicated by the Capital Asset Pricing Model (CAPM). 2. Calculate the value of each stock share using the constant growth formula. 3. Compare the values you calculated to each of the market prices for the top twenty stock picks. Are your calculations close approximations of the market prices? Why do you think there are differences? 4. What are the implications of your analysis to Fred's choice of stocks? 5. Think about your results in terms of claims of market efficiency. On average, over the long term, do you think that the models you used to calculate the stock values really works? Why or why not? 6. In light of your answer in number 5 above, how would you advise Fred? Fred pressed the 'retum' key, carrying out the trades he had figured would give him a good return. He had opened the online stock trading account in order to learn about the process of trading and to take advantage of his academic knowledge of how the markets determine stock values. He had taken several finance classes in his undergraduate degree, and had enjoyed learning the way investors decide how much to bid on stocks. Fred figured he could take advantage of this knowledge in creating more wealth than he could if he just invested in an investment fund. THE BROKER'S ADVICE When he opened the trading account, Fred had signed up for telephone access to a broker. The account allowed him a certain number of calls and a certain amount of time in consultation with the broker each month. Now, Fred had quite a sum of free cash in the account, money he had transferred from an investment fund that he was not very happy with. The amount he had to invest was about $68,000. He decided to take advantage of the advisement service, and made his first telephone call. "Welcome to Bettertrade services, Mr. Alberts. My name is Brad Cendron. How can I assist you today?", the voice asked. "Yes; I would like to get your advice on how to invest a sum of money. My objective is to invest this amount in stocks that appear to be undervalued by the market. Can you recommend about ten stocks that would fit that description?", Fred asked. "Oh, yes, I'd be happy to. We have listed our top bargains on the top stock picks" list on the website. Are you online now?", Brad asked. "Yes, I am," Fred replied. "Oh, I see it here. They are in order, according to your idea. of how much of a bargain they are, right?" "That's correct, Mr. Albert. We believe that these 20 stocks are going to have greater upside potential over time. I can help you make the transactions, if you'd like." "Well, I'm going to do a little more research on my own first, but thank you for the link. I'll just carry out transactions via the website, since the transaction fees are lower that way," Fred said. "OK. Mr. Albert, Brad replied. Let us know if you have other questions, or if we can assist you further." Fred printed out the list of stocks, and set about the task of collecting information about them. He went to the "market data" link on the company's website to get some information. For each firm, he downloaded the history of dividend payments, and the beta. He also downloaded current treasury bond rates and the rate of return on a broad market index, which he would use as an indicator of the market return. Fred summarized the information and prepared to determine the value of the stocks according to the financial models he had studied in college. Fred's collection of information and the current market prices of the stocks in the "top stock picks" list from his broker appear in Exhibits 1, 2, and 3. Exhibit 1. Top 20 Stock Picks List. Stock Rank 3 4 5 6 7 8 9 10 11 12 13 14 15 16 17 18 19 20 Price, 1/05/04 $14.89 529.02 $18.83 $93.48 $67.29 $3.28 $9.00 $55.91 $98.47 $43.07 $37 55 $38 30 $76.33 $57.09 $193.065 $38.33 $71.11 39:23 $19.36 $29.92 Exhibit 2. Dividend Histories and Beta. Stock Rank Total Dividend, 2003 $0.05 $0.00 $0.00 $1.25 $0.78 $0.00 $0.00 $0.00 56.22 $1.00 $0.00 $0.25 2 3 4 5 6 7 8 9 10 11 12 13 14 15 16 17 18 19 20 $0.08 $2.25 $5.80 $1.02 $8,00 $0.00 $1.00 $0.00 main with hole 5-Year Dividend Growth 0.58% -100.00% 0.00% 8.50% Treasury Bond Rate (historical) Return on a Broad Market Index 1.25% -9.00% -100.00% 0.00% 0.98% 0.48% -100.00% 2.10% -2.00% 4.00% -8.00% 13.00% 5.00% 0.00% 9:00% -100.00% Beta 0.74 23 1.89 1.31 1.52 4.1% 12.1% 1.04 1.99 0.89 1.06 1.76 0.91 18 0.82 1.12 0.00 101 *dividend growth is the compound growth rate between D, and D Exhibit 3. Other Financial Information. 0.87 1.11 0.78 1.2 Exhibit 4. Formulas from Fred's Old Textbooks. Constant Growth Valuation Model: D g Ves is the value of the share of common stock D, is the expected dividend (the last paid dividend times 1+g) Ky is the required return (Fred would use the CAPM to determine this) g is the growth rate of the dividend Capital Asset Pricing Model Formula: k=k+B(-k) Keity is the required return on the common shares kas is the rate of return on treasury bonds ky is the rate of return on a broad market index B is a measure of systematic risk for the company (the 'beta') REQUIRED 1. For each stock listed, calculate the required return as indicated by the Capital Asset Pricing Model (CAPM). 2. Calculate the value of each stock share using the constant growth formula. 3. Compare the values you calculated to each of the market prices for the top twenty stock picks. Are your calculations close approximations of the market prices? Why do you think there are differences? 4. What are the implications of your analysis to Fred's choice of stocks? 5. Think about your results in terms of claims of market efficiency. On average, over the long term, do you think that the models you used to calculate the stock values really works? Why or why not? 6. In light of your answer in number 5 above, how would you advise Fred?
Expert Answer:

Related Book For 

Introduction to Probability
ISBN: 978-0716771098
1st edition
Authors: Mark Daniel Ward, Ellen Gundlach
Posted Date:
Students also viewed these business communication questions
-
In order to learn how people actually play in game situations, economists and other social scientists frequently conduct experiments in which subjects play games for money. One such game is known as...
-
What do we learn about the process of launching and growing a firm, in general, from the GoldieBloxBeastie Boys dispute?
-
What processes do consumers use in order to learn by making associations with meaning?
-
Explain whether each of the following events represents (i) a shi of the supply curve or (ii) a movement along the supply curve. a. More homeowners put their houses up for sale during a real estate...
-
True or false? If false, explain why. a. The total public debt is more relevant to an economy than the public debt as a percentage of GDP. b. An internally held public debt is like a debt of the left...
-
Voss Visuals produces tablets and books. Total overhead costs traditionally have been allocated on the basis of direct labor hours. After implementing activity-based costing, managers determined the...
-
The following TI-84 Plus display presents the results of a test of the null hypothesis H0: 1 = 0. a. What is the alternate hypothesis? b. What is the value of the test statistic? c. How many degrees...
-
The following data relate to the operations of Lim Corporation, a wholesale distributor of consumer goods: Current assets as of December 31: Cash . . . . . . . . . . . . . . . . . . . . . . . . . . ....
-
A. Equity Impact of Sales Tax Policy (address and compare the scenarios) B. Equity Impact of Income Tax Policy (address and compare the scenarios) C. State Revenue Impact of Scenario 2 for Sales Tax...
-
Lewis Company reports the following fixed budget and actual results for May. Prepare a flexible budget performance report showing variances between budgeted and actual results. (Indicate the effect...
-
Make presentation on PESTLE ANALYSIS: case study Duke Raleigh Hospital
-
Provide your perspective on the Kelly v. United States. Discuss why you agree or disagree with the outcome, your reasoning, and support your perspective using supporting evidence in the form of...
-
Write the SQL statements that provide the following database functionality: Query 1. Write an SQL statement that correctly uses the 'LIKE' symbol on an alphanumeric field to select a subset of data....
-
Sales Variable costs Northeast Division $4,210,000 Competitor $2,610,000 70% of sales 60% of sales Fixed costs $1,074,000 $ 968,000 Invested capital $ 900,000 $ 304,000 Management has determined that...
-
Given the relation U below, use ordered pair notation to express the relation U o U. UoU {Ex: (a, b), (b, c) 1 a b U C 2 3
-
Please write ARMv7 assembly program for following C program. Assume that variables are stored in memory and their addresses can be obtained by using ADR pseudo op? i = 10; if (i>j) { if (j <5) { a =...
-
In some scattering experiments, the speed of the particles is tuned so that their de Broglie wavelength has a specific value. If a wavelength of 0 . 1 1 7 nm is required. a ) How fast must a neutron...
-
Identify one local business that uses a perpetual inventory system and another that uses a periodic system. Interview an individual in each organization who is familiar with the inventory system and...
-
Find (a) The density (y) of y, (b) The conditional density fX|Y(x | y) of X given Y. Let fX,Y (x,y) be constant on the region where x and nonnegative and x + y 30.
-
In a certain game, a player wants to roll five dice and get as many l's as possible. Here is the scheme: Round 1: The player rolls all five of the dice, and notices how many l's appear. Round 2: The...
-
Returning to Exercise 44.12, we still need to know the region where U and V can occur in the U, V plane, in other words, we need to identify the region where the density fU,V(u,v) is relevant. a....
-
What is the purpose of tests of controls?
-
Why are some tests of controls performed during the interim period?
-
What four factors should the auditor consider in deciding what evidence, if any, needs to be obtained during the period from the interim date to the balance sheet date?

Study smarter with the SolutionInn App