

Question: FRED QUESTION 1.30-year fixed rate mortgage average in the U.S. I'll refer to this as the 30-year rate Fred Code: MORTGAGE3OUS For this problem you
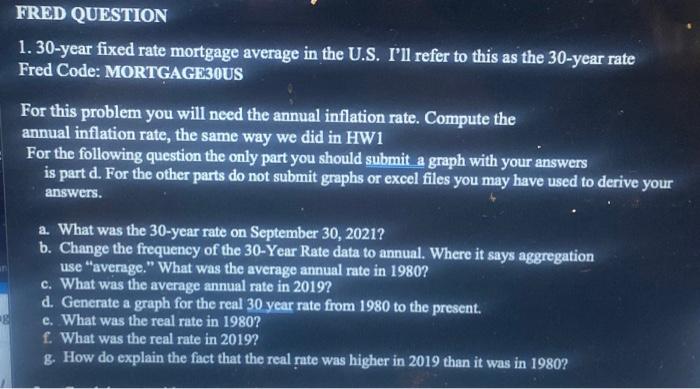
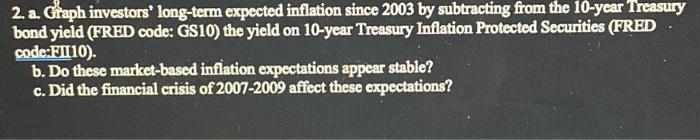
FRED QUESTION 1.30-year fixed rate mortgage average in the U.S. I'll refer to this as the 30-year rate Fred Code: MORTGAGE3OUS For this problem you will need the annual inflation rate. Compute the annual inflation rate, the same way we did in HW1 For the following question the only part you should submit a graph with your answers is part d. For the other parts do not submit graphs or excel files you may have used to derive your answers. a. What was the 30-year rate on September 30, 2021? b. Change the frequency of the 30-Year Rate data to annual. Where it says aggregation use "average." What was the average annual rate in 1980? c. What was the average annual rate in 2019? d. Generate a graph for the real 30 year rate from 1980 to the present. e. What was the real rate in 1980? f. What was the real rate in 2019? g. How do explain the fact that the real rate was higher in 2019 than it was in 1980? 2. a. Graph investors' long-term expected inflation since 2003 by subtracting from the 10-year Treasury bond yield (FRED code: GS10) the yield on 10-year Treasury Inflation Protected Securities (FRED code:FI:10). b. Do these market-based inflation expectations appear stable? c. Did the financial crisis of 2007-2009 affect these expectations? FRED QUESTION 1.30-year fixed rate mortgage average in the U.S. I'll refer to this as the 30-year rate Fred Code: MORTGAGE3OUS For this problem you will need the annual inflation rate. Compute the annual inflation rate, the same way we did in HW1 For the following question the only part you should submit a graph with your answers is part d. For the other parts do not submit graphs or excel files you may have used to derive your answers. a. What was the 30-year rate on September 30, 2021? b. Change the frequency of the 30-Year Rate data to annual. Where it says aggregation use "average." What was the average annual rate in 1980? c. What was the average annual rate in 2019? d. Generate a graph for the real 30 year rate from 1980 to the present. e. What was the real rate in 1980? f. What was the real rate in 2019? g. How do explain the fact that the real rate was higher in 2019 than it was in 1980? 2. a. Graph investors' long-term expected inflation since 2003 by subtracting from the 10-year Treasury bond yield (FRED code: GS10) the yield on 10-year Treasury Inflation Protected Securities (FRED code:FI:10). b. Do these market-based inflation expectations appear stable? c. Did the financial crisis of 2007-2009 affect these expectations
Step by Step Solution
There are 3 Steps involved in it

Get step-by-step solutions from verified subject matter experts