

Question: Free Cash Flow Analysis Need help with calculating the fields that are highlighted in green and not currently filled in. Please show how you arrived
Free Cash Flow Analysis
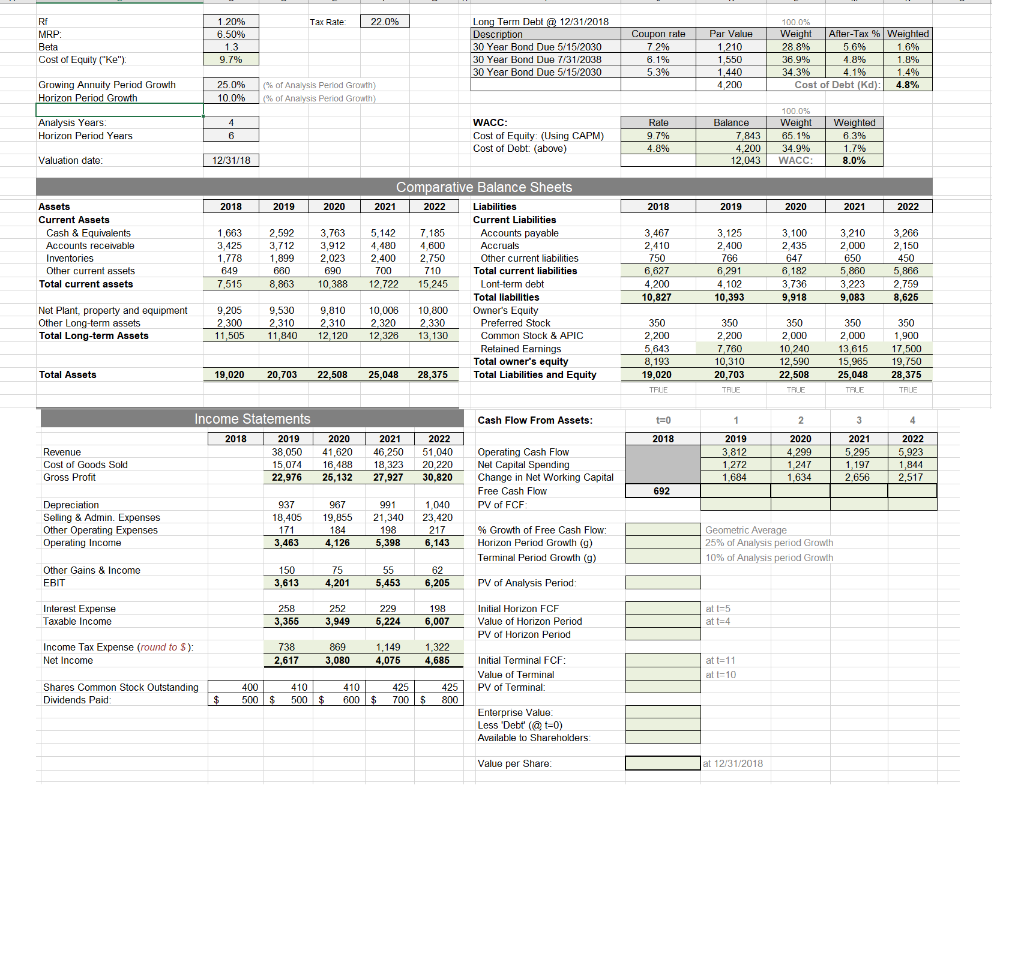
Need help with calculating the fields that are highlighted in green and not currently filled in. Please show how you arrived at each answer.
Ri 22 0% Long Term Debt12/31/2018 MRP Cost of Equity (Ke". Growing Annuity Periad Growth rale Par Value | Weight After-Tax %|Weighted 30 Year Bond Due 15/2030 30 Year Bond Due 7:31/2038 36.9% 25 0% (% or Analysis Period Growth) Cost of Debt (Kd) 4.8 Period Groath 100 0% Years WACC Cost of Equity (Using CAPM) Cost of Debt (above) Weight Weighted Horizon Period Years Valuation date 12/31/18 12.043 WACC 8.0% Comparative Balance Sheets 2018 2019 2020 2021 2022 Liabilities Current Liabilities 2018 2019 2020 2021 2022 Current Assets Cash & Equivelents Accounts recervable 3,210 3,266 2,000 650 1,663 2,592 3,7635,142 7,185 Accounts payable Accruals Other current liabilities 4,480 ,899 2,023 2,400 2,750 Other current assets Total current assets Total current liabilities 6,627 7,515 8,863 0,388 2.722 15,245 Lont-term debt Total liabilities 10,00 Owner's Equity 10,827 Net Plant, property and equipment Other Long-term assets 9,205 9,530 9,810 10,0O6 2,320 2.330 Preferred Stock Total Long-term Assets11505 11,840 12,120 12328 13,130 Common Stock & APIC 5,643 10 240 12,590 22,508 13.615 7.500 15,965 25,048 Total owner's equity Total Assets 19,02020,70322,508 25,048 28,375 otal Liabilities and Equity 19,020 20,703 28,375 TRLE Income Statements Cash Flow From Assets: 2019 38,050 41,620 46,250 51,040 Operating Cash Flow 15,074 16,188 18,323 20 220 Nel Capital Spending 22,976 25,132 27,927 30,820 Changc in Net Working Capital 2020 2021 2022 2020 2021 2022 Cost of Goods Sold Gross Profit Free Cash Flow PV of FCF Depreciation Seling & Admin. Expenses Other Operating Expenses Operating Income 18,405 19,855 21,340 23,420 % Growth of Free Cash Flow: Horizon Periad Growh (g) Geometic Average 25% of Analysis period Growth 10% of Analysis period Growth ,126 5,398 6,143 Terminal Period Growth (g) Other Gains & Income EBIT 3,613 4,201 5,453 6,205 PV of Analysis Period Interest Expense Taxablo Income 258 252 229 Initial Horizon FCF Value of Horizon Period Pv of Horizon Period at t-5 738 Income lax Expense (round to s) Nct Incomo 3,080 4,686 Initial Terminal FCF Value of Terminal at t-11 at t-10 4,076 Shares Common Stock Outstanding Dividends Paid 425 PV of Tenminal: 500 500 600 700 Enterprise Value. Less Debt ( t-0) Available to Sharehoders Value per Share at 12/31/2018
Step by Step Solution
There are 3 Steps involved in it

Get step-by-step solutions from verified subject matter experts