

Question: Frel GDP data at constant and current Prices from 2010 to 20no Sri Lanka Conplant prices current price / mines. ) (MORs ) 2010 6,
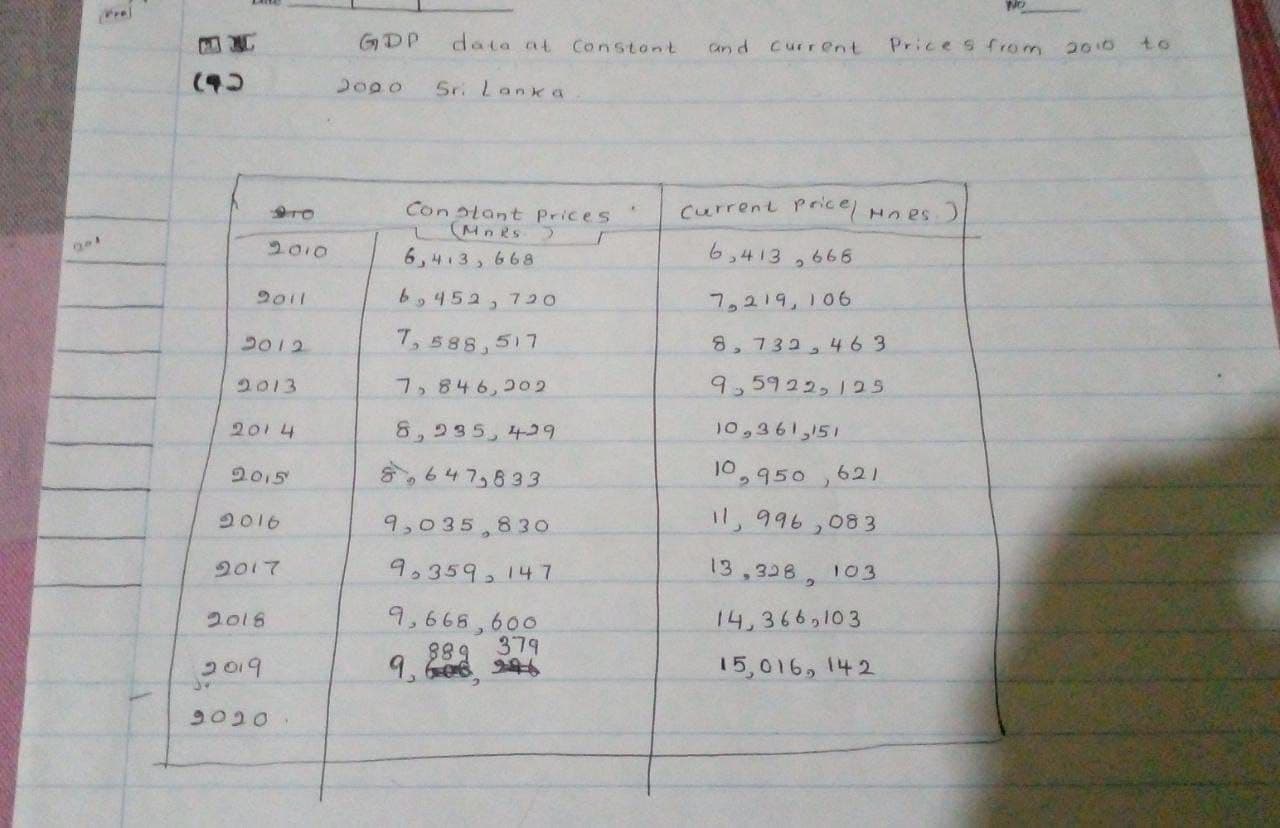
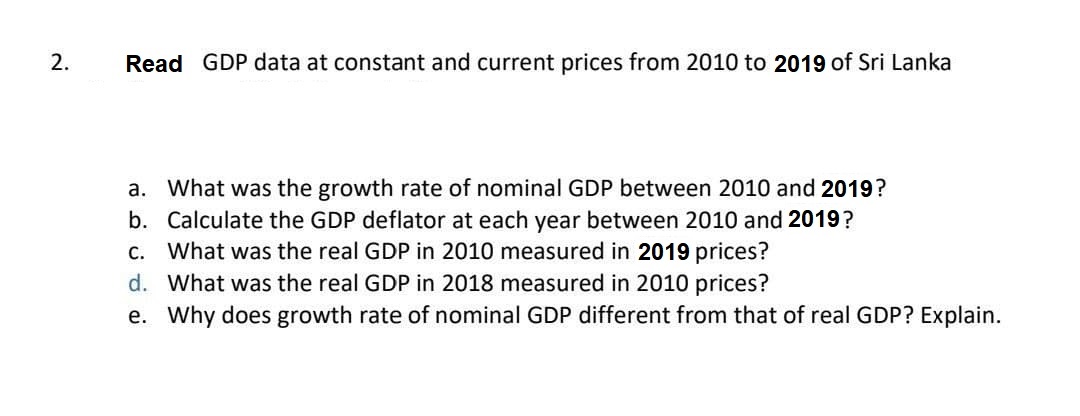
Frel GDP data at constant and current Prices from 2010 to 20no Sri Lanka Conplant prices current price / mines. ) (MORs ) 2010 6, 413, 668 6, 413 , 666 by 452, 720 7, 219, 106 2012 7, 588 517 8 , 732 , 463 2013 7, 846, 202 9, 59 22, 125 2014 8, 285 429 10,361, 151 20.5 8 647, 833 10, 950 621 2016 9,035 830 11 996, 083 2017 9 359, 147 13, 328 103 2018 9 , 6 68, 600 14, 366, 103 889 379 2019 15, 016 142 90202. Read GDP data at constant and current prices from 2010 to 2019 of Sri Lanka a. What was the growth rate of nominal GDP between 2010 and 2019? b. Calculate the GDP deflator at each year between 2010 and 2019? c. What was the real GDP in 2010 measured in 2019 prices? d. What was the real GDP in 2018 measured in 2010 prices? e. Why does growth rate of nominal GDP different from that of real GDP? Explain
Step by Step Solution
There are 3 Steps involved in it

Get step-by-step solutions from verified subject matter experts