

Question: Frequency 0 1500 Frequency 0 1500 Frequency 0 1500 60 40 80 60 Histogram A 100 Units of Values Histogram B 120 140 80
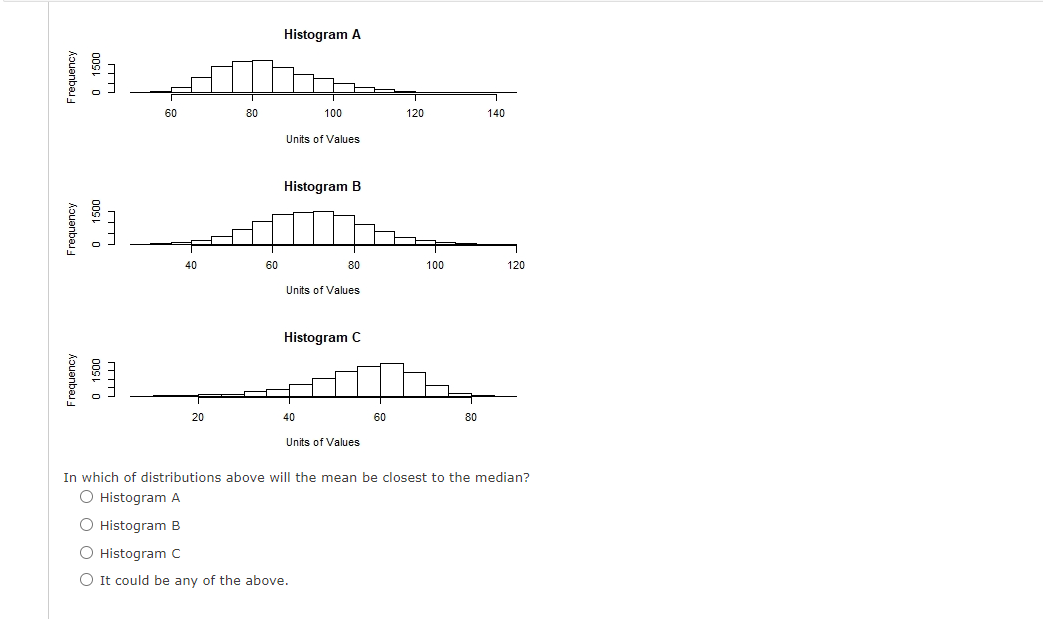
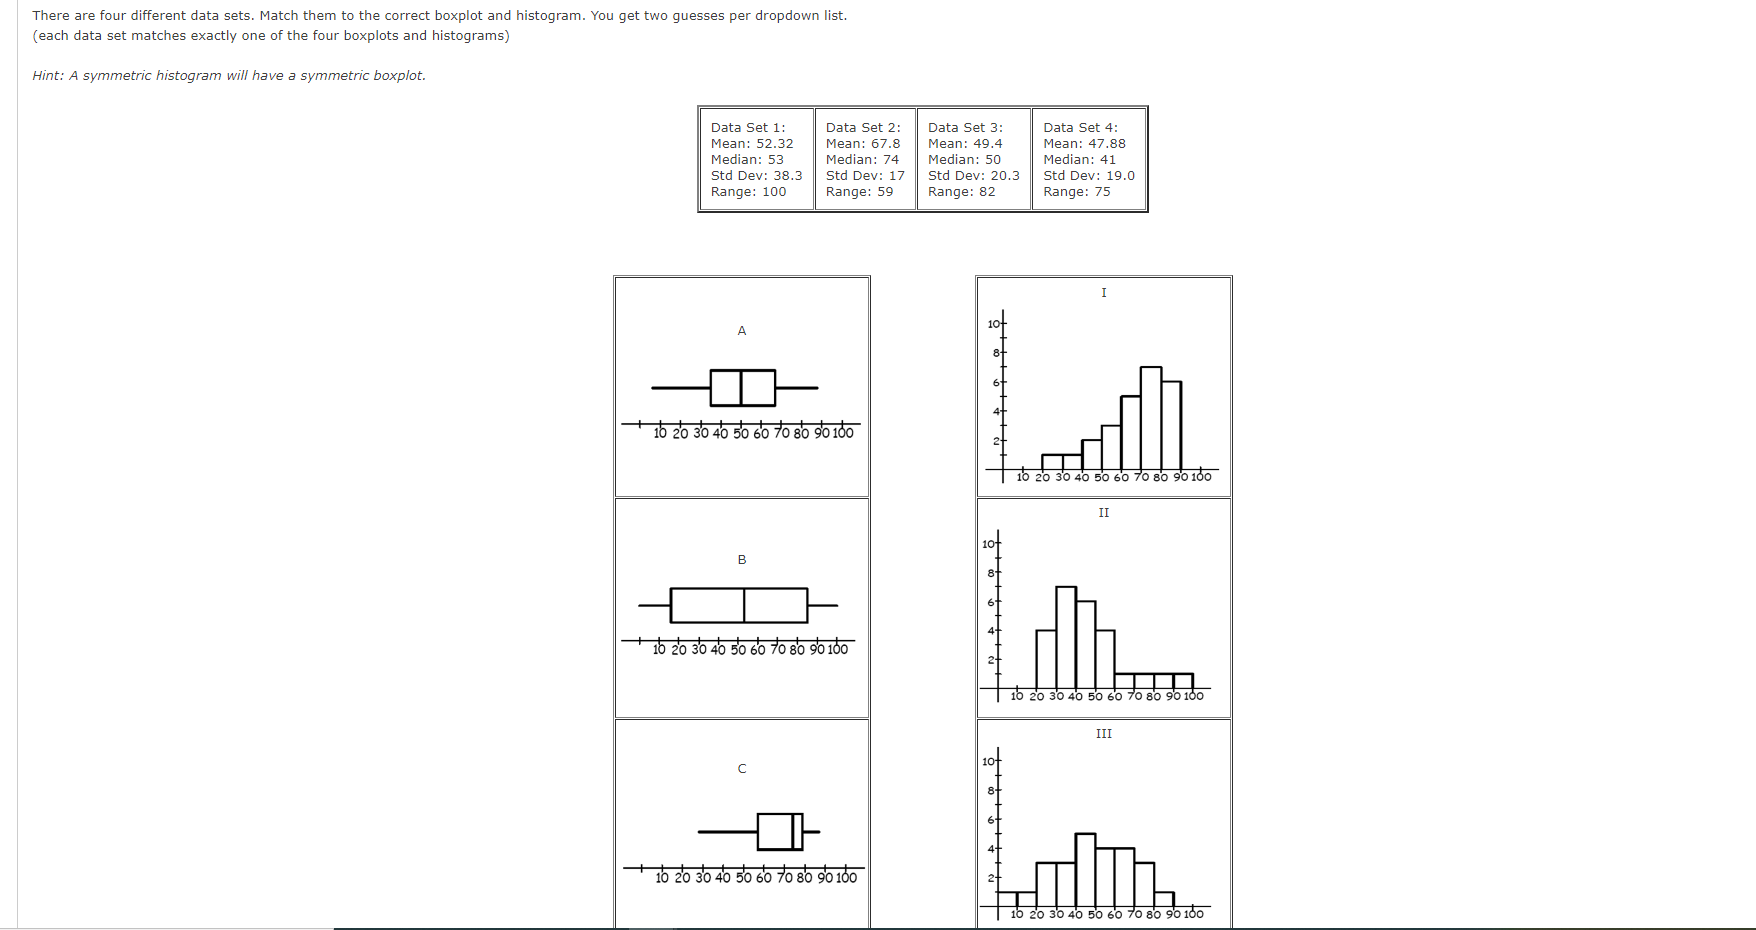
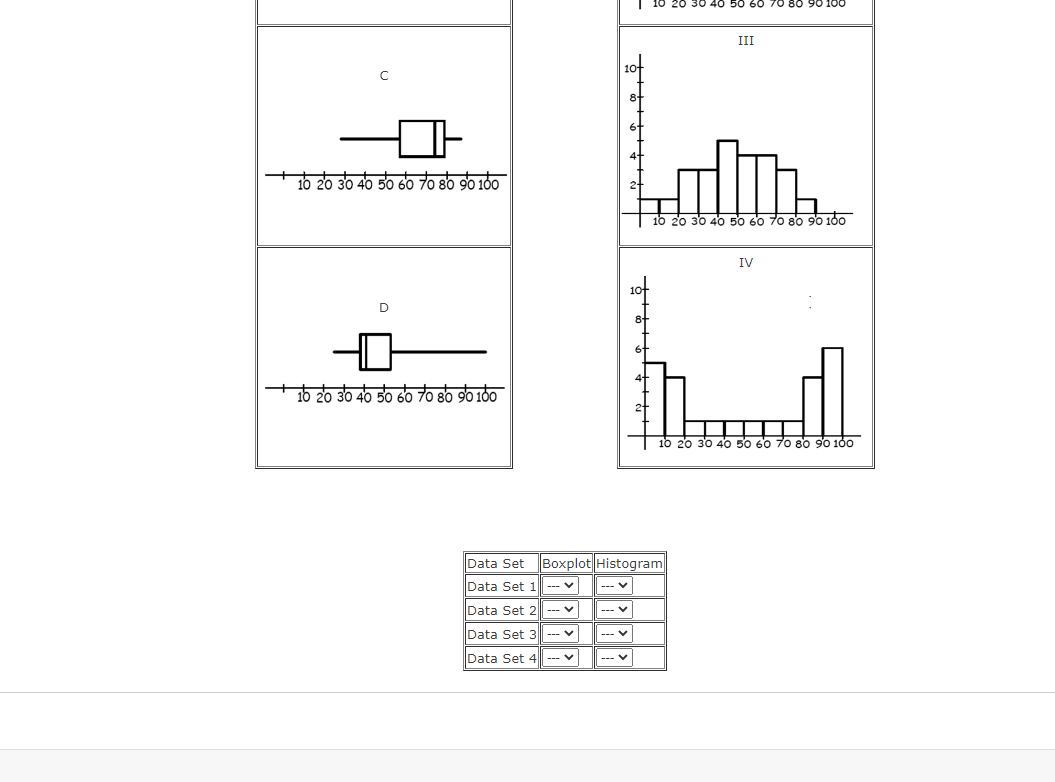
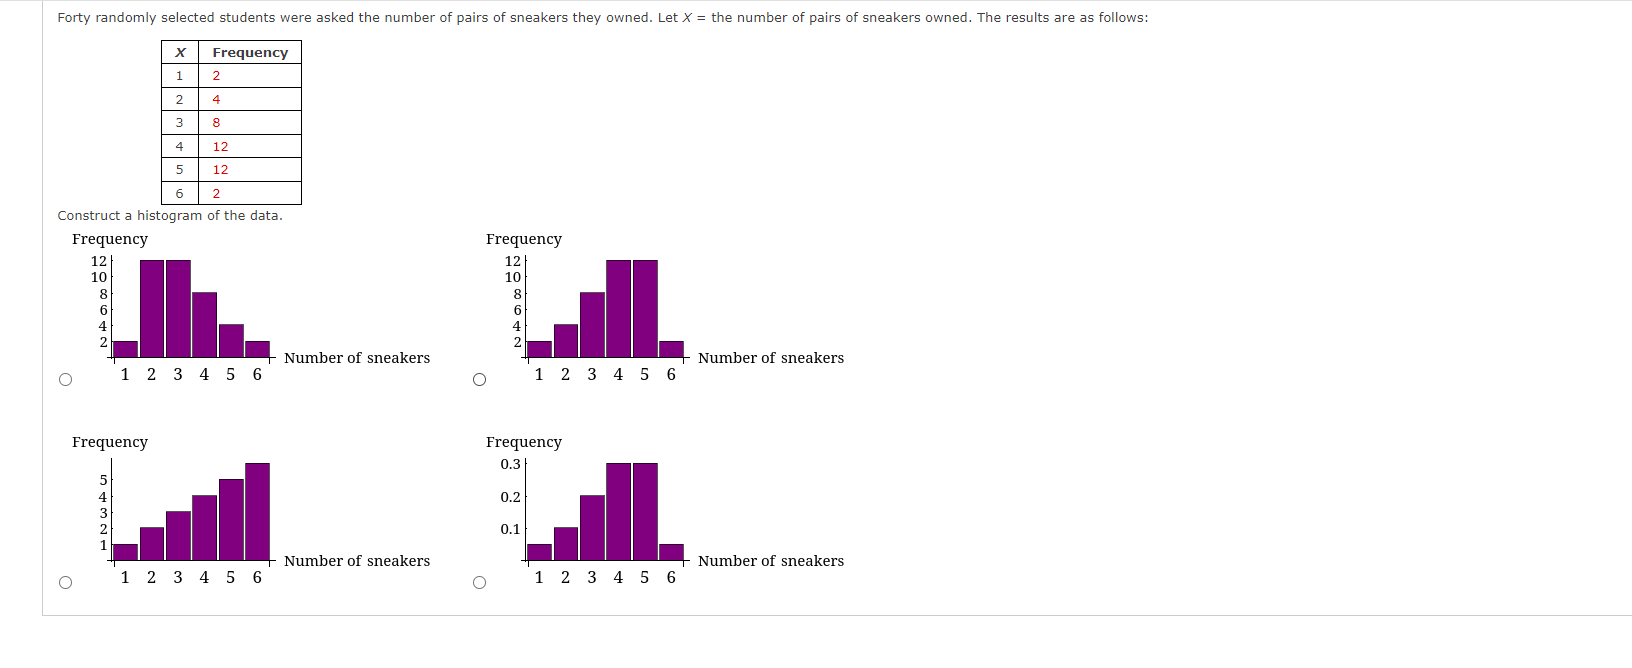
Frequency 0 1500 Frequency 0 1500 Frequency 0 1500 60 40 80 60 Histogram A 100 Units of Values Histogram B 120 140 80 100 120 Units of Values Histogram C 20 40 Units of Values 60 80 In which of distributions above will the mean be closest to the median? O Histogram A Histogram B Histogram C It could be any of the above. There are four different data sets. Match them to the correct boxplot and histogram. You get two guesses per dropdown list. (each data set matches exactly one of the four boxplots and histograms) Hint: A symmetric histogram will have a symmetric boxplot. Data Set 1: Mean: 52.32 Median: 53 Std Dev: 38.3 Range: 100 Data Set 2: Mean: 67.8 Median: 74 Std Dev: 17 Range: 59 Data Set 3: Mean: 49.4 Median: 50 Std Dev: 20.3 Range: 82 Data Set 4: Mean: 47.88 Median: 41 Std Dev: 19.0 Range: 75 A + 10 20 30 40 50 60 70 80 90 100 B + 10 20 30 40 50 60 70 80 90 100 20 30 40 50 60 70 80 90 100 II 20 30 40 50 60 70 80 90 100 III 10 20 30 40 50 60 70 80 90 100 10 20 30 40 50 60 70 80 90 100 C D 10 20 40 50 60 70 80 90 100 10 20 30 40 50 60 70 80 90 100 III 10 20 30 40 50 60 70 80 90 100 IV 10 20 30 40 50 60 70 80 90 100 10 20 30 40 50 60 70 80 90 100 Data Set Data Set 1 Data Set 2 Data Set 3 Data Set 4 Boxplot Histogram --- --- Forty randomly selected students were asked the number of pairs of sneakers they owned. Let X = the number of pairs of sneakers owned. The results are as follows: Frequency 1 2 2 4 3 8 4 12 5 12 6 2 Construct a histogram of the data. Frequency 12 10 8 Frequency 12 10 8 6 Number of sneakers Number of sneakers 1 2 3 4 5 6 1 2 3 4 5 6 Frequency 5 4 3 Frequency 0.3 0.2 0.1 Number of sneakers 1 2 3 4 5 6 Number of sneakers 1 2 3 4 5 6
Step by Step Solution
There are 3 Steps involved in it

Get step-by-step solutions from verified subject matter experts