

Question: Frequency 10+ 8- 6 2 1 4 7 10 13 16 19 data Based on the histogram above, what is the class width? Class
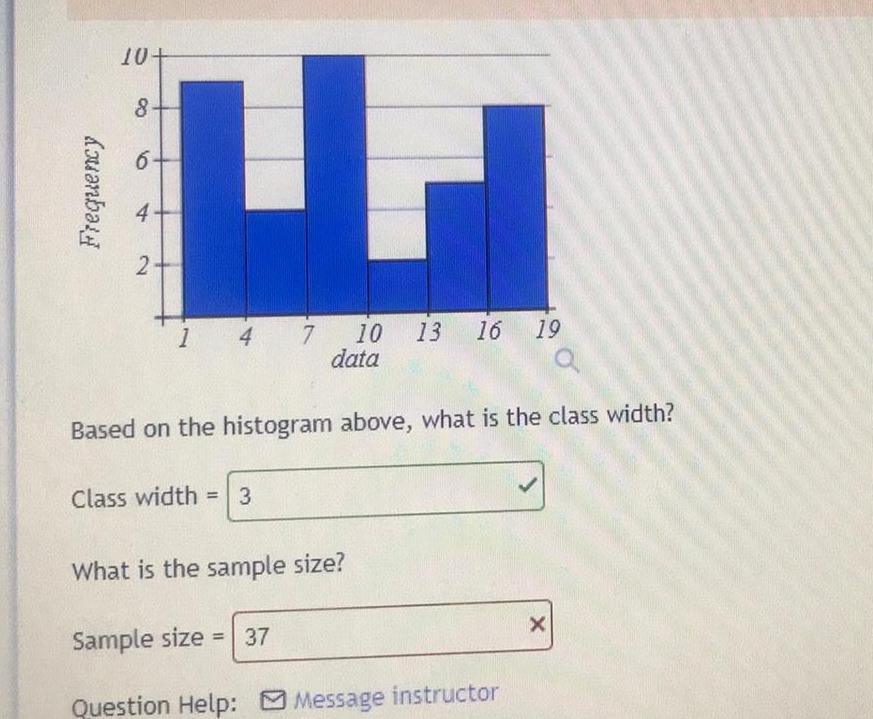
Frequency 10+ 8- 6 2 1 4 7 10 13 16 19 data Based on the histogram above, what is the class width? Class width = 3 What is the sample size? Sample size = 37 Question Help: Message instructor
Step by Step Solution
There are 3 Steps involved in it
1 Expert Approved Answer
Step: 1 Unlock

Question Has Been Solved by an Expert!
Get step-by-step solutions from verified subject matter experts
Step: 2 Unlock
Step: 3 Unlock