

Question: Frequency 90 80 Randomization Test Histogram for Time (Min) by Frame Hot - = 0, : - # 0 -0.535 0 0.535 70 0.369
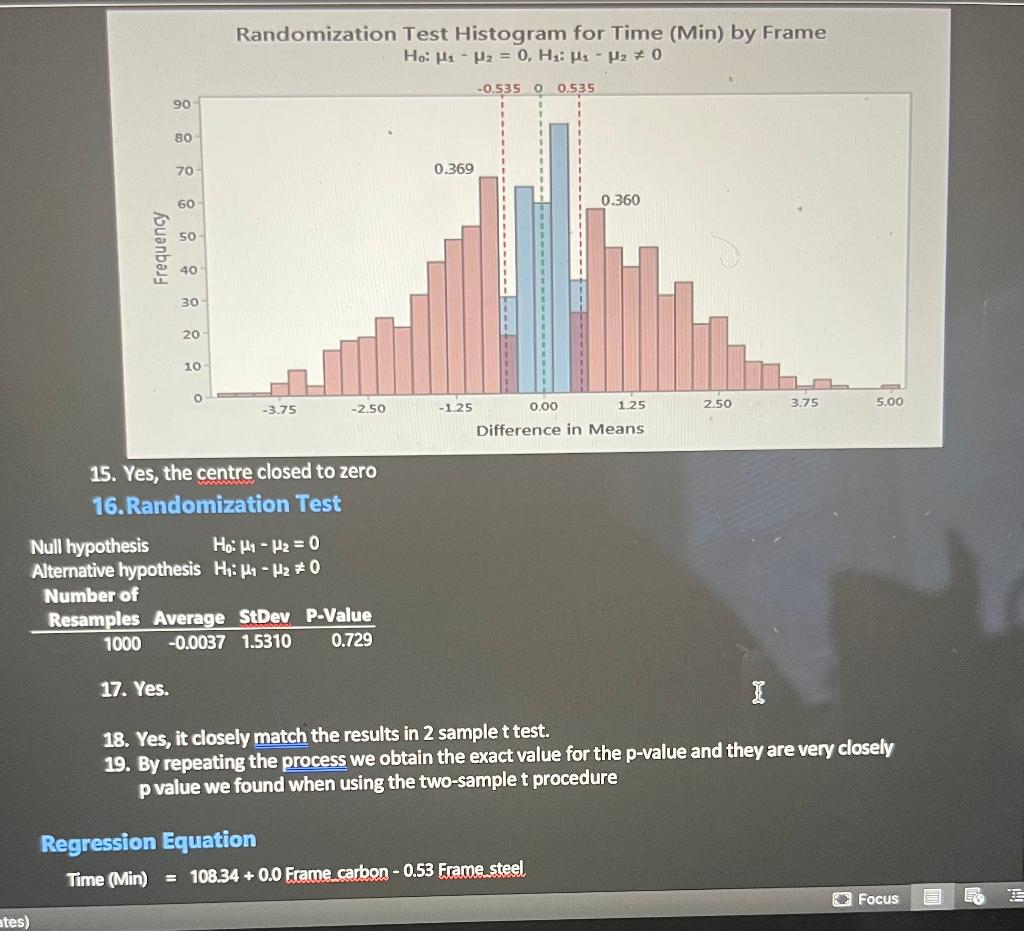
Frequency 90 80 Randomization Test Histogram for Time (Min) by Frame Hot - = 0, : - # 0 -0.535 0 0.535 70 0.369 60 0.360 50 40 30 20 10 0 -3.75 -2.50 -1.25 0.00 1.25 2.50 3.75 5.00 Difference in Means ates) 15. Yes, the centre closed to zero 16. Randomization Test Null hypothesis Ho: - H = 0 Alternative hypothesis H: -H2 #0 Number of Resamples Average StDev P-Value 1000 -0.0037 1.5310 17. Yes. 0.729 18. Yes, it closely match the results in 2 sample t test. I 19. By repeating the process we obtain the exact value for the p-value and they are very closely p value we found when using the two-sample t procedure Regression Equation Time (Min) 108.34+0.0 Frame carbon -0.53 Frame steel Focus E
Step by Step Solution
There are 3 Steps involved in it

Get step-by-step solutions from verified subject matter experts