

Question: Frequency Distribution of Sample Mean Results Sample Mean less than 6 2.5 Frequency 25 to 120 greater than 5 4.5 At the beginning of Week
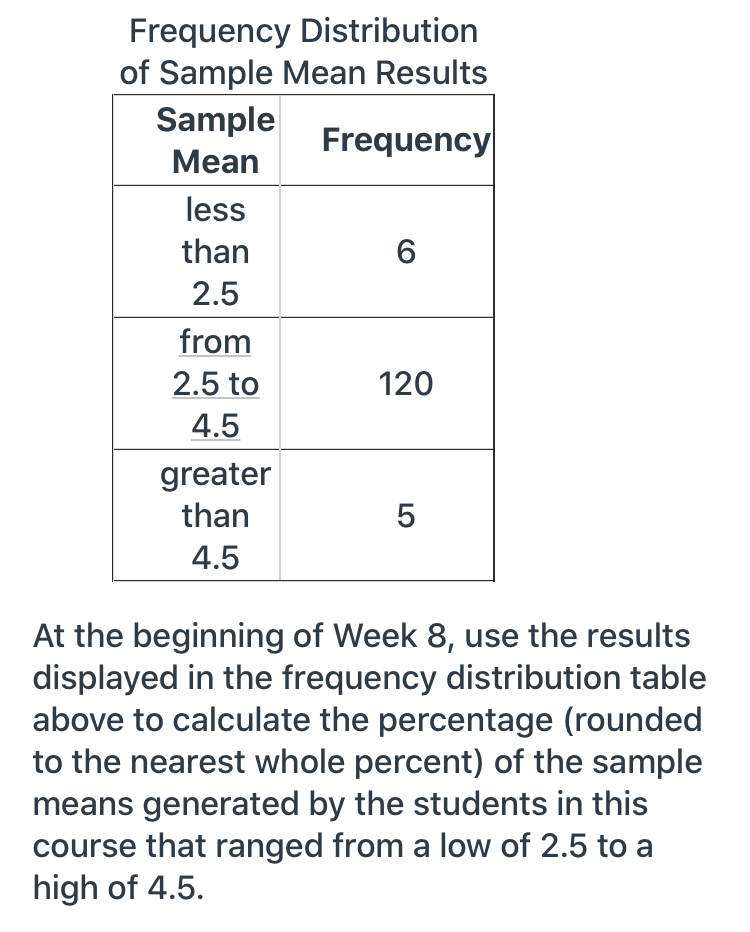
Frequency Distribution of Sample Mean Results Sample Mean less than 6 2.5 Frequency 25 to 120 greater than 5 4.5 At the beginning of Week 8, use the results displayed in the frequency distribution table above to calculate the percentage (rounded to the nearest whole percent) of the sample means generated by the students in this course that ranged from a low of 2.5 to a high of 4.5
Step by Step Solution
There are 3 Steps involved in it
1 Expert Approved Answer
Step: 1 Unlock

Question Has Been Solved by an Expert!
Get step-by-step solutions from verified subject matter experts
Step: 2 Unlock
Step: 3 Unlock