

Question: Frequency Explain why. 100 200 300 0 400 500 600 700 800 900 [0, 100] (100, 200] (200, 300] (300; 400] (400, 500] 500, 600]
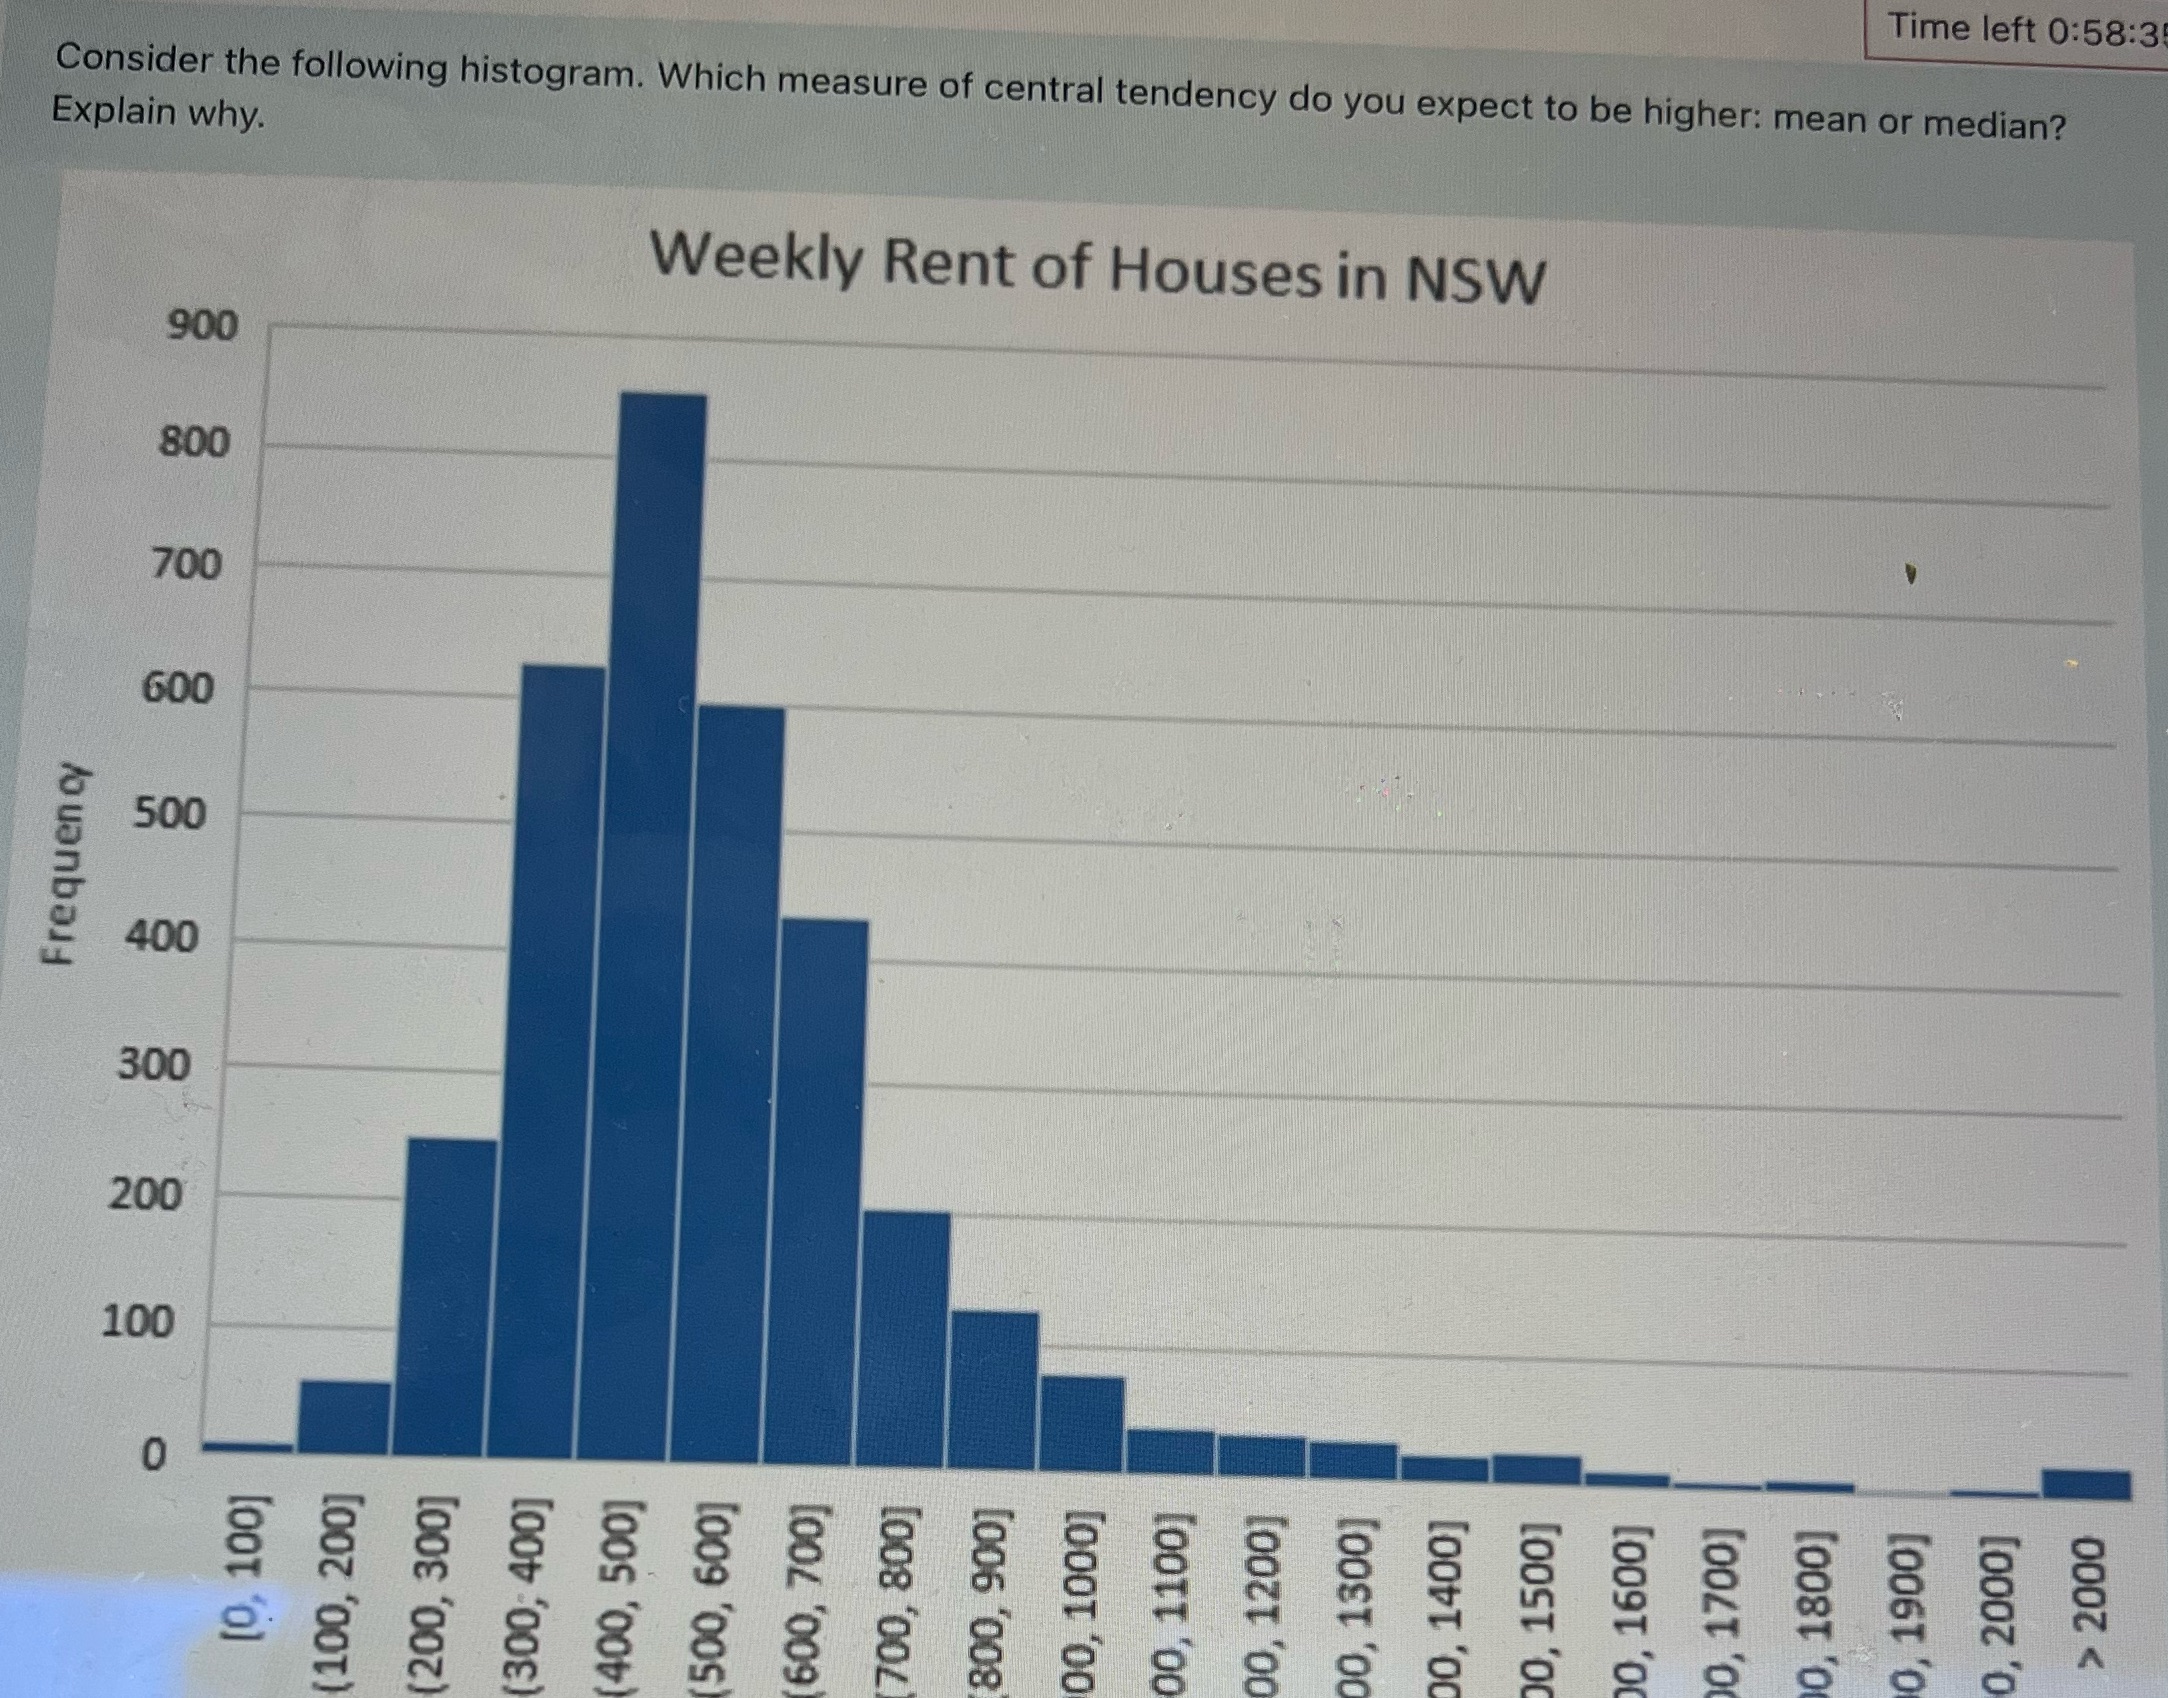
Frequency Explain why. 100 200 300 0 400 500 600 700 800 900 [0, 100] (100, 200] (200, 300] (300; 400] (400, 500] 500, 600] (600, 700] (700, 800] 800, 900] Consider the following histogram. Which measure of central tendency do you expect to be higher: mean or median? 00, 1000] Weekly Rent of Houses in NSW 00, 1100] 00, 1200] 00, 1300] 00, 1400] 00, 1500] 0, 1600] 0, 1700] 0, 1800] 0, 1900] 0, 2000] Time left 0:58:3 > 2000
Step by Step Solution
There are 3 Steps involved in it
1 Expert Approved Answer
Step: 1 Unlock

Question Has Been Solved by an Expert!
Get step-by-step solutions from verified subject matter experts
Step: 2 Unlock
Step: 3 Unlock