

Question: frequency histogram, and frequency polygon, relative frequency histogram, and Stem and Leaf Plot. In your distribution table, include the midpoints, relative frequencies, and cumulative frequencies.
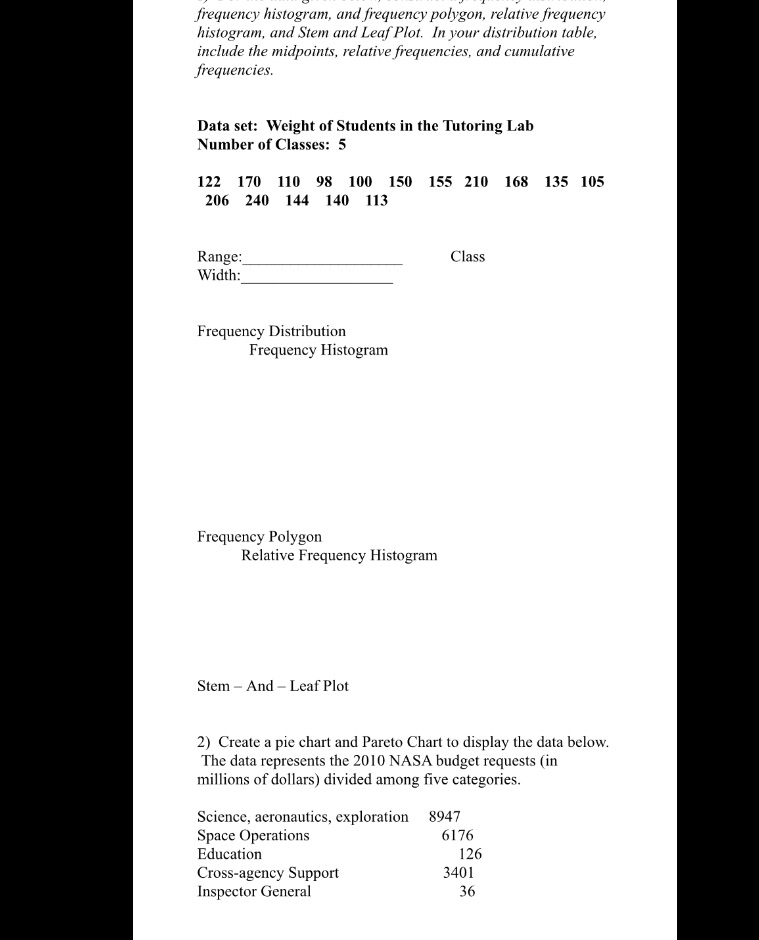
frequency histogram, and frequency polygon, relative frequency histogram, and Stem and Leaf Plot. In your distribution table, include the midpoints, relative frequencies, and cumulative frequencies. Data set: Weight of Students in the Tutoring Lab Number of Classes: 5 122 170 110 98 100 150 155 210 168 135 105 206 240 144 140 113 Range: Class Width: Frequency Distribution Frequency Histogram Frequency Polygon Relative Frequency Histogram Stem - And - Leaf Plot 2) Create a pie chart and Pareto Chart to display the data below. The data represents the 2010 NASA budget requests (in millions of dollars) divided among five categories. Science, aeronautics, exploration 8947 Space Operations 6176 Education 126 Cross-agency Support 3401 Inspector General 36
Step by Step Solution
There are 3 Steps involved in it

Get step-by-step solutions from verified subject matter experts