

Question: Frequency S 4 2 1 0 1 2 hot 5 7 6 8 3 4 PARTS O Integers 9 10 11 12 The bar graph
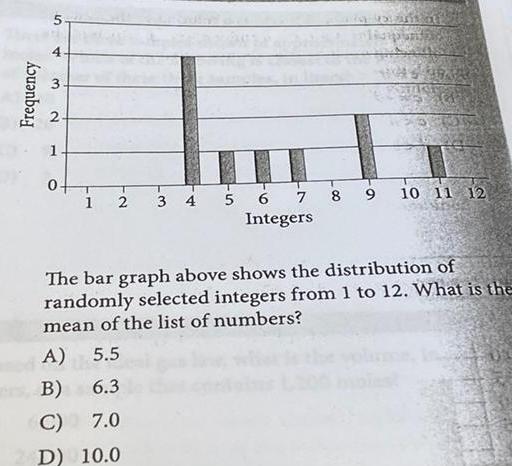

Frequency S 4 2 1 0 1 2 hot 5 7 6 8 3 4 PARTS O Integers 9 10 11 12 The bar graph above shows the distribution of randomly selected integers from 1 to 12 What is the mean of the list of numbers A 5 5 B 6 3 C 7 0 D 10 0
Step by Step Solution
There are 3 Steps involved in it
1 Expert Approved Answer
Step: 1 Unlock

Question Has Been Solved by an Expert!
Get step-by-step solutions from verified subject matter experts
Step: 2 Unlock
Step: 3 Unlock