

Question: Frequency Table Activity X % Dog Cat Bird Fish 1. A researcher studies the effects of having pets on stress levels. The research typically shows
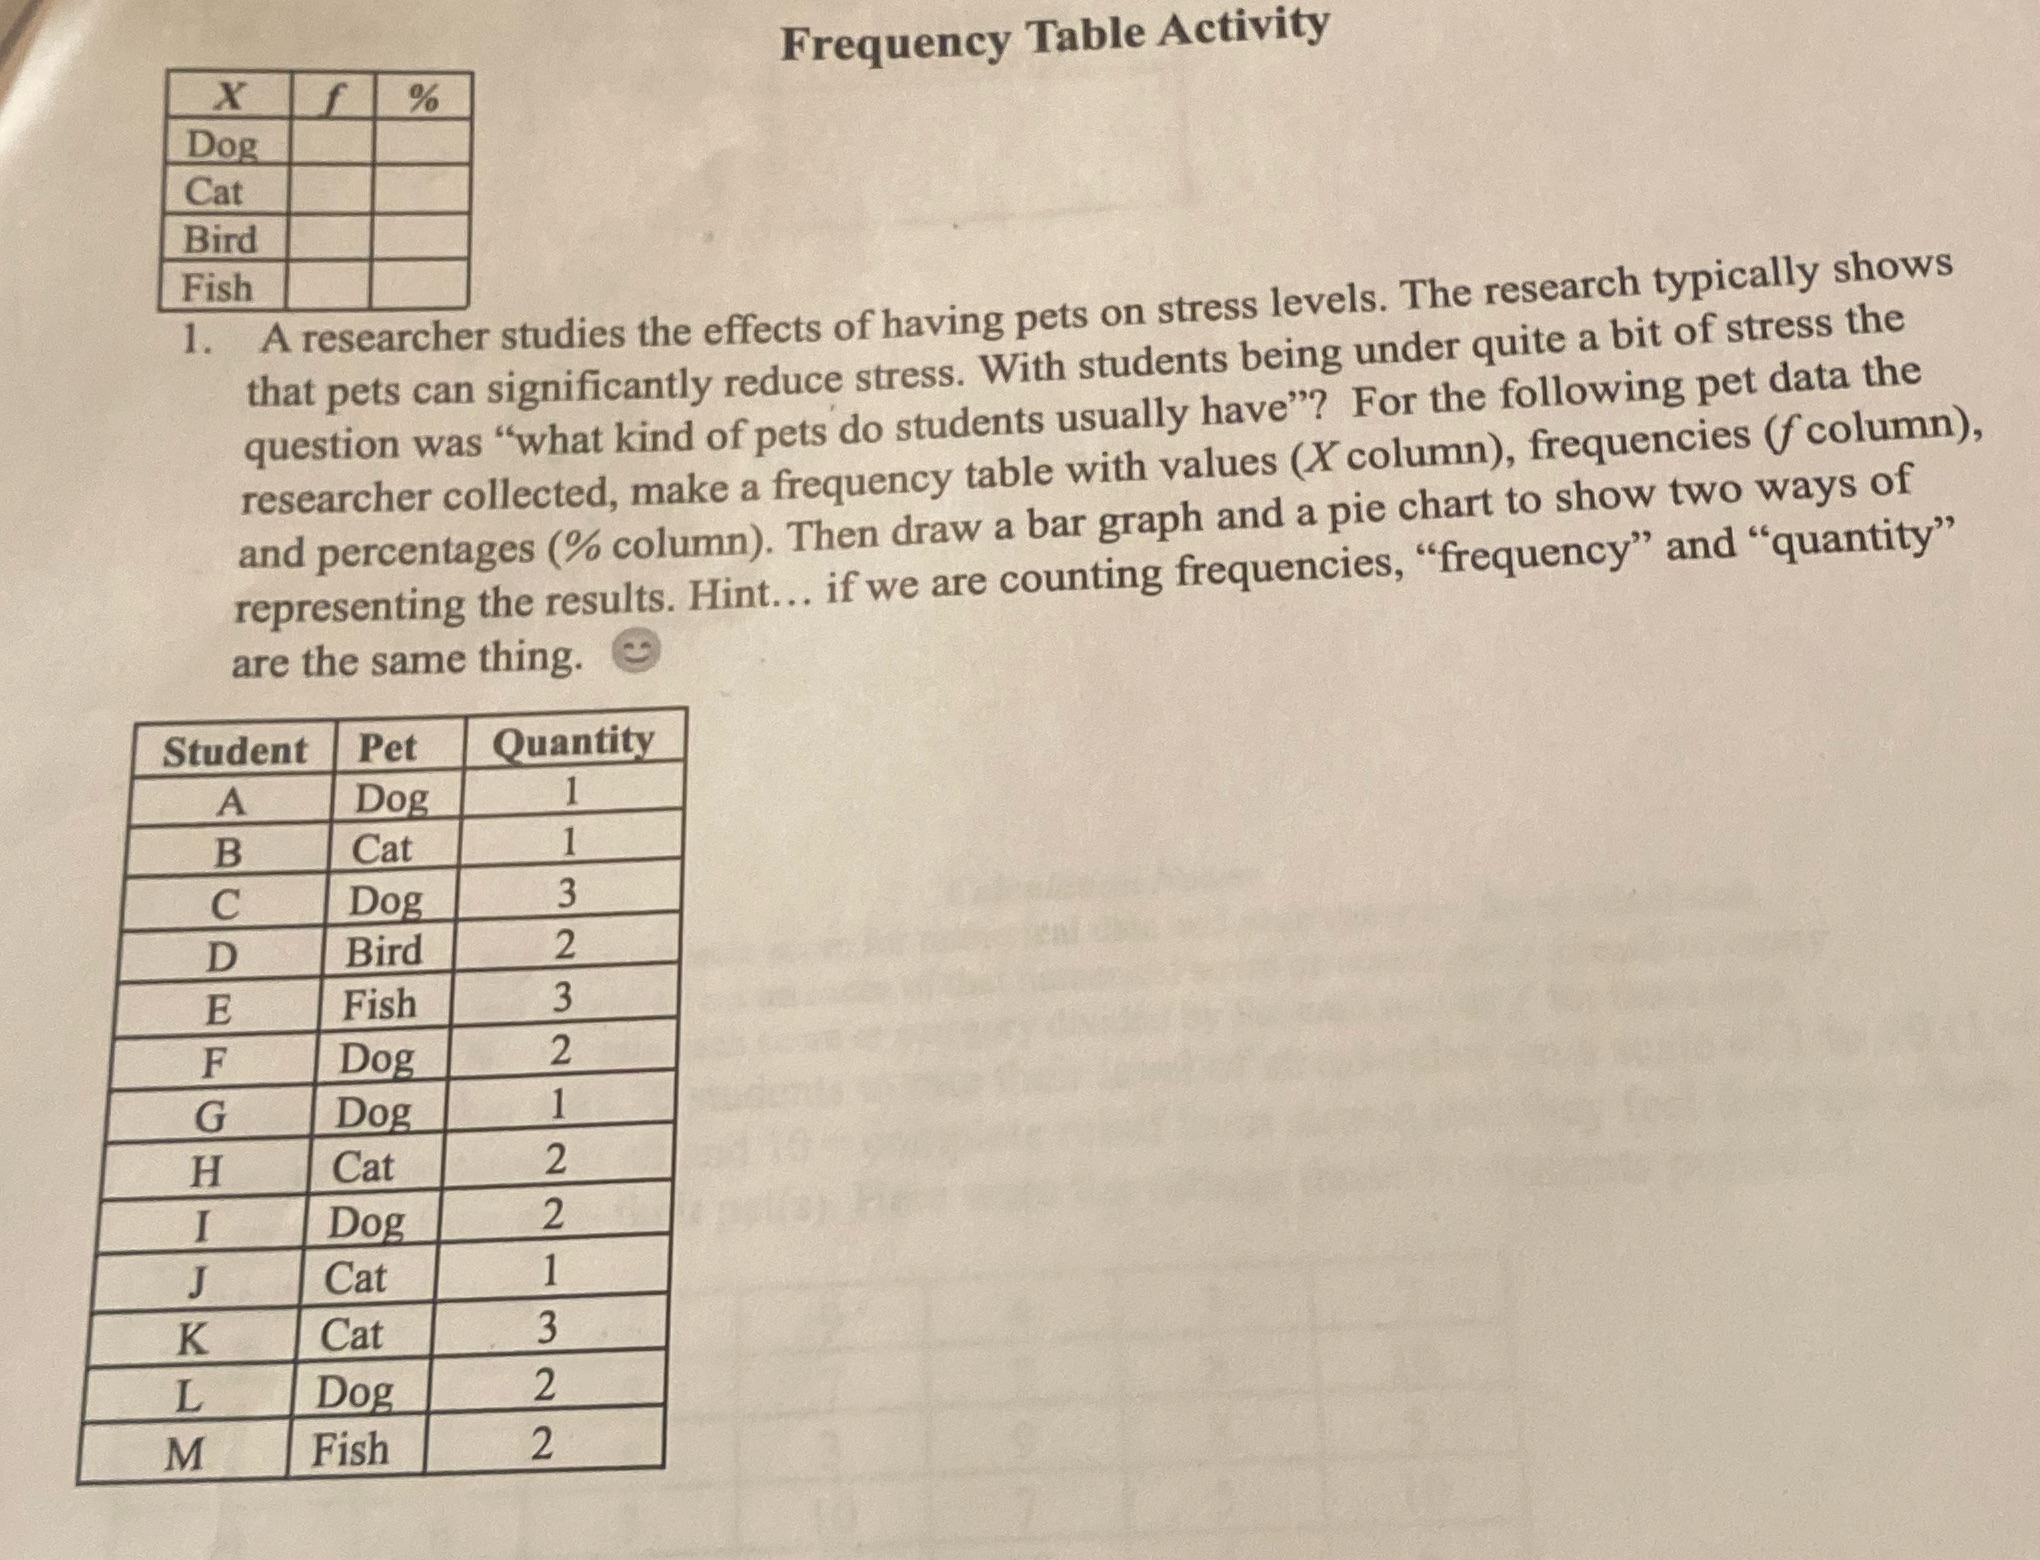
Frequency Table Activity X % Dog Cat Bird Fish 1. A researcher studies the effects of having pets on stress levels. The research typically shows that pets can significantly reduce stress. With students being under quite a bit of stress the question was "what kind of pets do students usually have"? For the following pet data the researcher collected, make a frequency table with values (X column), frequencies (fcolumn), and percentages (% column). Then draw a bar graph and a pie chart to show two ways of representing the results. Hint... if we are counting frequencies, "frequency" and "quantity" are the same thing. Student Pet Quantity A Dog Cat - B C Dog 3 D Bird 2 E Fish W F Dog 2 G Dog H Cat 2 - Dog - N J Cat K Cat L Dog N M Fish
Step by Step Solution
There are 3 Steps involved in it

Get step-by-step solutions from verified subject matter experts