

Question: frequency table The following data represent glucose levels ( my / 10oml) in the blood for a random Sample of 27 non-obase adult subjects. 1
frequency table
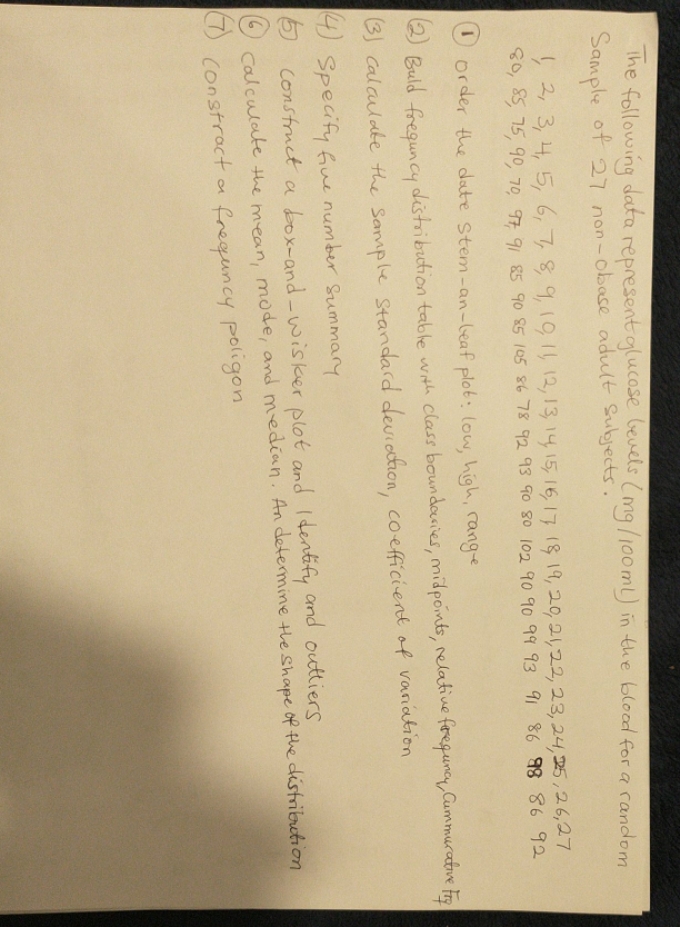
The following data represent glucose levels ( my / 10oml) in the blood for a random Sample of 27 non-obase adult subjects. 1 2 , 3, 1, 5 , 6 , 7, 8, 9, 10, 1 1, 12 , 13, 14 15, 16, 17 18 19, 20, 21, 22, 23, 24, 25, 26, 27 80, 85, 75, 90, 70 97 91 85 90 85 105 86 78 92 93 90 80 102 90 90 99 93 91 86 98 86 92 1 order the date stem- an-leaf plot: low, high, range 2) Buld freguncy distribution table with class boundaries, midpoints, relative frequncy, Cummurative Fry (3) calculate the sample standard deviation, coefficient of variation 4) specify five number summary 5) construct a box-and- wisker plot and Identify and outliers calculate the mean, mode, and median. An determine the shape of the distribution construct a frequncy poligon
Step by Step Solution
There are 3 Steps involved in it

Get step-by-step solutions from verified subject matter experts