

Question: From a parent - progeny correlation / Regression analysis where the researcher is looking at breeding for horse size, which of the following is /
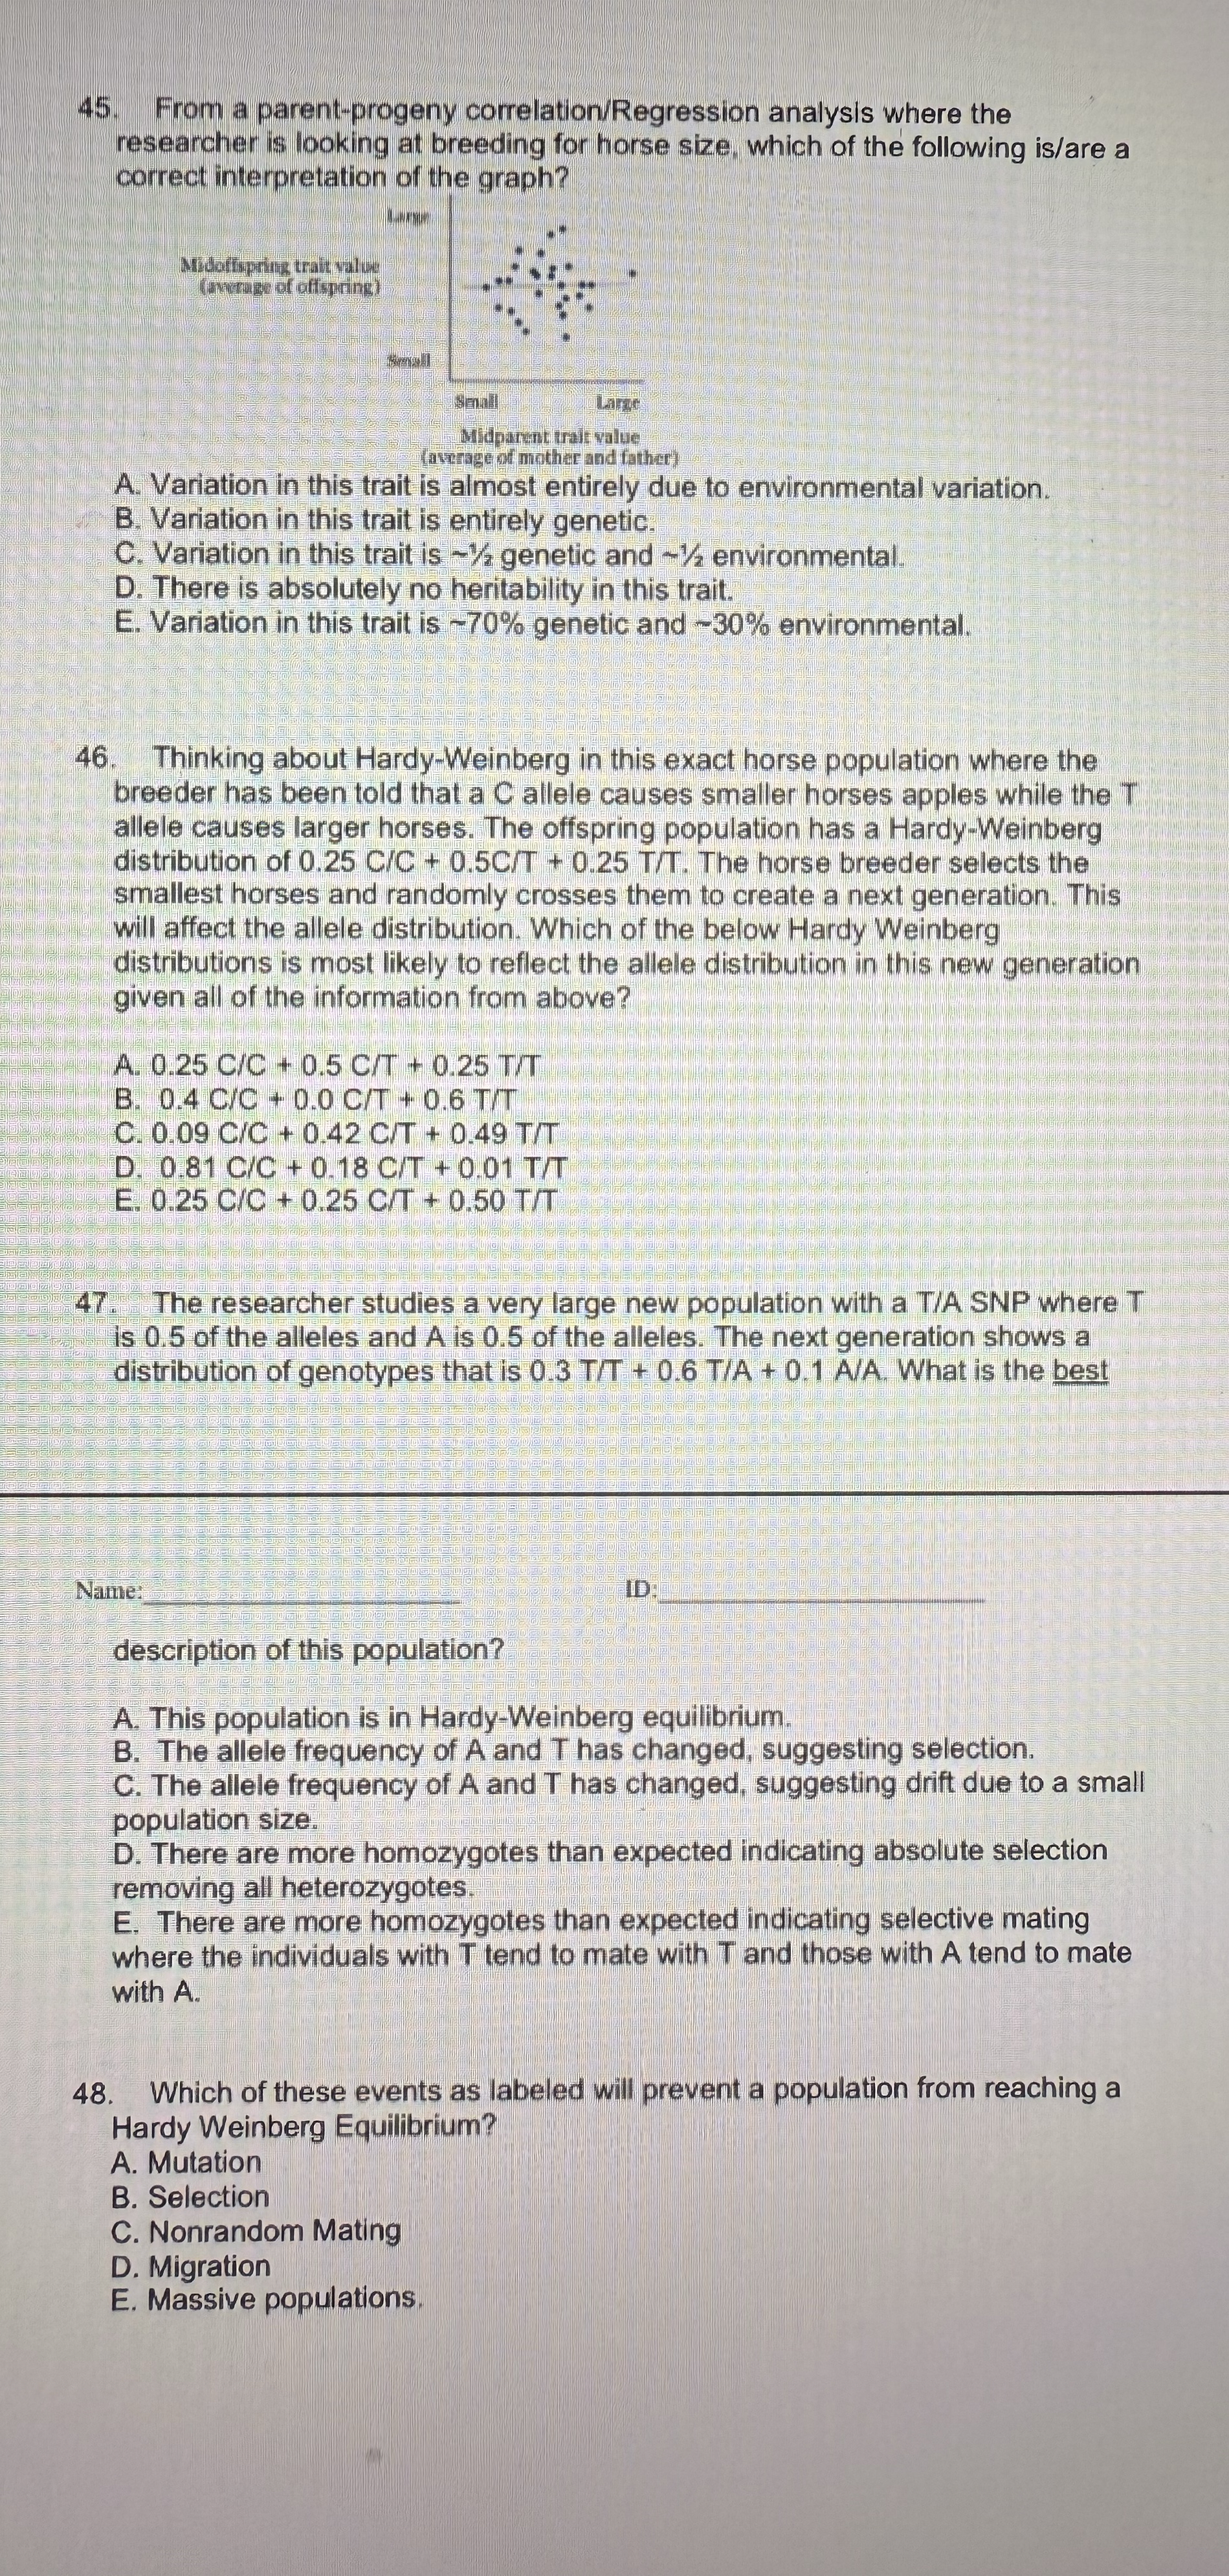
From a parentprogeny correlationRegression analysis where the researcher is looking at breeding for horse size, which of the following isare a correct interpretation of the graph?
A Variation in this trait is almost entirely due to environmental variation.
B Variation in this trait is entirely genetic.
C Variation in this trait is genetic and environmental.
D There is absolutely no heritability in this trait.
E Variation in this trait is genetic and environmental.
Thinking about HardyWeinberg in this exact horse population where the breeder has been told that a C allele causes smaller horses apples while the T allele causes larger horses. The offspring population has a HardyWeinberg distribution of The horse breeder selects the smallest horses and randomly crosses them to create a next generation. This will affect the allele distribution. Which of the below Hardy Weinberg distributions is most likely to reflect the allele distribution in this new generation given all of the information from above?
A
B
C
D
E
The researcher studies a very large new population with a TA SNP where T is of the alleles and is of the alleles. The next generation shows a distribution of genotypes that is What is the best
Name: ID:
description of this population?
A This population is in HardyWeinberg equilibrium.
B The allele frequency of A and Thas changed, suggesting selection.
C The allele frequency of A and has changed, suggesting drift due to a small population size.
D There are more homozygotes than expected indicating absolute selection removing all heterozygotes.
E There are more homozygotes than expected indicating selective mating where the individuals with tend to mate with and those with A tend to mate with
Which of these events as labeled will prevent a population from reaching a Hardy Weinberg Equilibrium?
A Mutation
B Selection
C Nonrandom Mating
D Migration
E Massive populations.
Step by Step Solution
There are 3 Steps involved in it
1 Expert Approved Answer
Step: 1 Unlock

Question Has Been Solved by an Expert!
Get step-by-step solutions from verified subject matter experts
Step: 2 Unlock
Step: 3 Unlock