

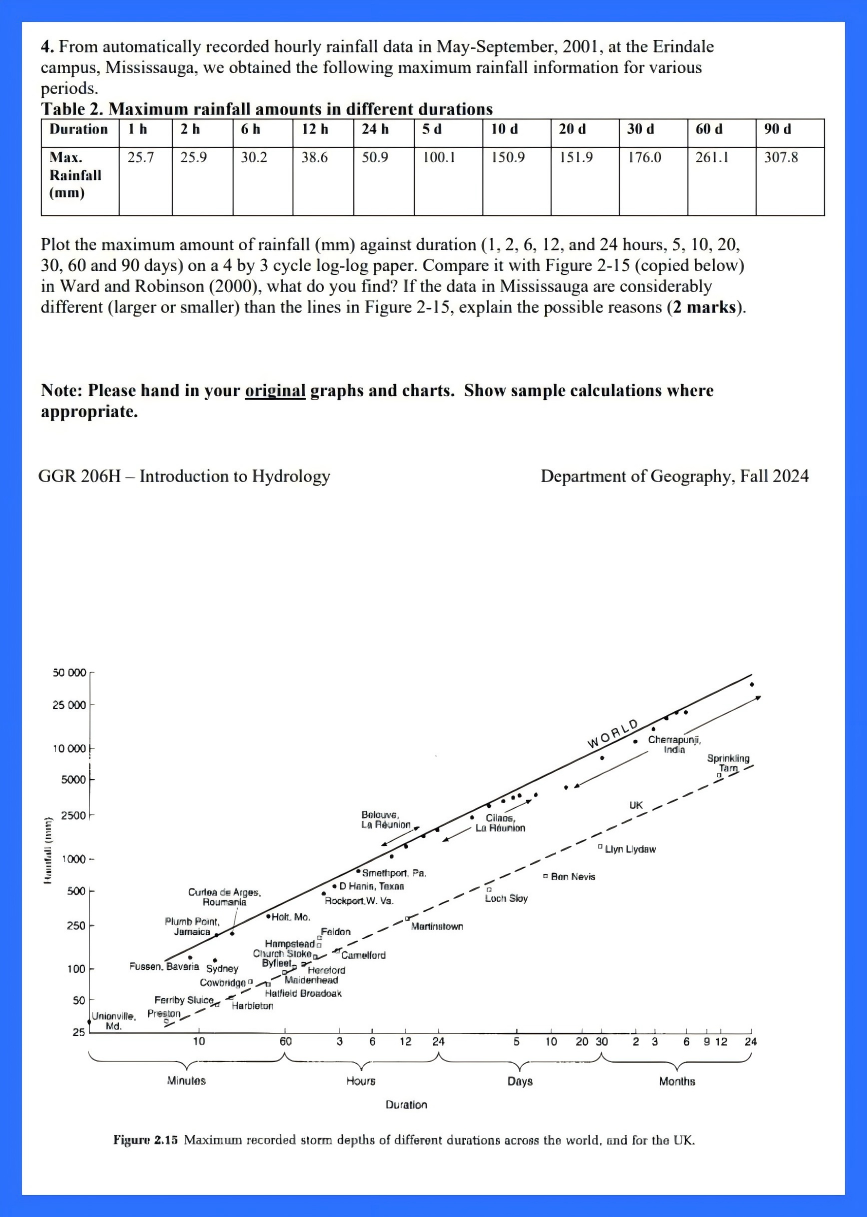
Question: From automatically recorded hourly rainfall data in May - September, 2 0 0 1 , at the Erindale campus, Mississauga, we obtained the following maximum
From automatically recorded hourly rainfall data in MaySeptember, at the Erindale
campus, Mississauga, we obtained the following maximum rainfall information for various
periods.
Table Maximum rainfall amounts in different durations
Plot the maximum amount of rainfall against duration and hours,
and days on a by cycle loglog paper. Compare it with Figure copied below
in Ward and Robinson what do you find? If the data in Mississauga are considerably
different larger or smaller than the lines in Figure explain the possible reasons marks
Note: Please hand in your original graphs and charts. Show sample calculations where
appropriate.
GGR H Introduction to Hydrology
Department of Geography, Fall
Figure Maximum recorded storm depths of different durations acrobs the world, and for the UK
Step by Step Solution
There are 3 Steps involved in it
1 Expert Approved Answer
Step: 1 Unlock

Question Has Been Solved by an Expert!
Get step-by-step solutions from verified subject matter experts
Step: 2 Unlock
Step: 3 Unlock