

Question: from date result How do the Ab affect NO Production what can you infer from that? Graph 2: nitric concentration begin{tabular}{|lrrrrrr|} hline & multicolumn{1}{l}{1} &
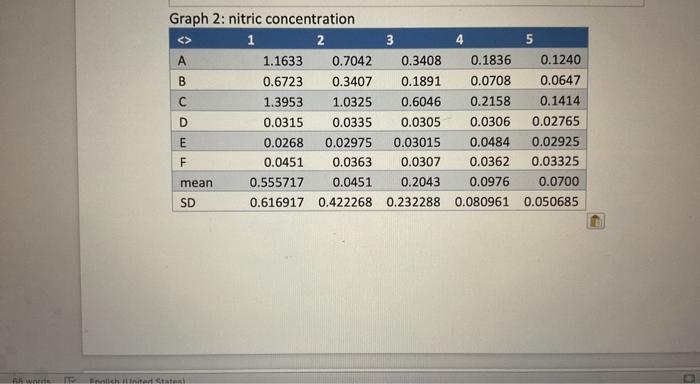
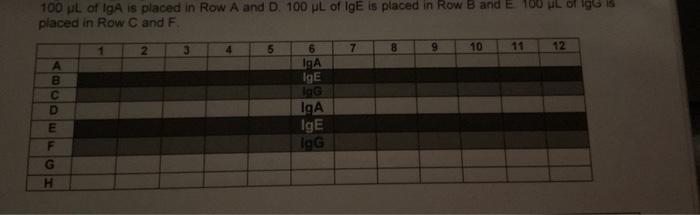
Graph 2: nitric concentration \begin{tabular}{|lrrrrrr|} \hline & \multicolumn{1}{l}{1} & \multicolumn{2}{l}{2} & \multicolumn{2}{l}{3} & \multicolumn{2}{l|}{\multicolumn{1}{l|}{5}} \\ \hline A & 1.1633 & 0.7042 & 0.3408 & 0.1836 & 0.1240 \\ \hline B & 0.6723 & 0.3407 & 0.1891 & 0.0708 & 0.0647 \\ \hline C & 1.3953 & 1.0325 & 0.6046 & 0.2158 & 0.1414 \\ \hline D & 0.0315 & 0.0335 & 0.0305 & 0.0306 & 0.02765 \\ \hline E & 0.0268 & 0.02975 & 0.03015 & 0.0484 & 0.02925 \\ \hline F & 0.0451 & 0.0363 & 0.0307 & 0.0362 & 0.03325 \\ \hline mean & 0.555717 & 0.0451 & 0.2043 & 0.0976 & 0.0700 \\ \hline SD & 0.616917 & 0.422268 & 0.232288 & 0.080961 & 0.050685 \\ \hline \end{tabular} 100L of IgA is placed in Row A and D. 100L of IgE is placed in Row B and E100L of igS is placed in Row C and F Graph 2: nitric concentration \begin{tabular}{|lrrrrrr|} \hline & \multicolumn{1}{l}{1} & \multicolumn{2}{l}{2} & \multicolumn{2}{l}{3} & \multicolumn{2}{l|}{\multicolumn{1}{l|}{5}} \\ \hline A & 1.1633 & 0.7042 & 0.3408 & 0.1836 & 0.1240 \\ \hline B & 0.6723 & 0.3407 & 0.1891 & 0.0708 & 0.0647 \\ \hline C & 1.3953 & 1.0325 & 0.6046 & 0.2158 & 0.1414 \\ \hline D & 0.0315 & 0.0335 & 0.0305 & 0.0306 & 0.02765 \\ \hline E & 0.0268 & 0.02975 & 0.03015 & 0.0484 & 0.02925 \\ \hline F & 0.0451 & 0.0363 & 0.0307 & 0.0362 & 0.03325 \\ \hline mean & 0.555717 & 0.0451 & 0.2043 & 0.0976 & 0.0700 \\ \hline SD & 0.616917 & 0.422268 & 0.232288 & 0.080961 & 0.050685 \\ \hline \end{tabular} 100L of IgA is placed in Row A and D. 100L of IgE is placed in Row B and E100L of igS is placed in Row C and F
Step by Step Solution
There are 3 Steps involved in it

Get step-by-step solutions from verified subject matter experts