

Question: from left to right 2018 -2017-2016-2015 please help me answer this tables and show me how the method this is principles of managerial finance 2018
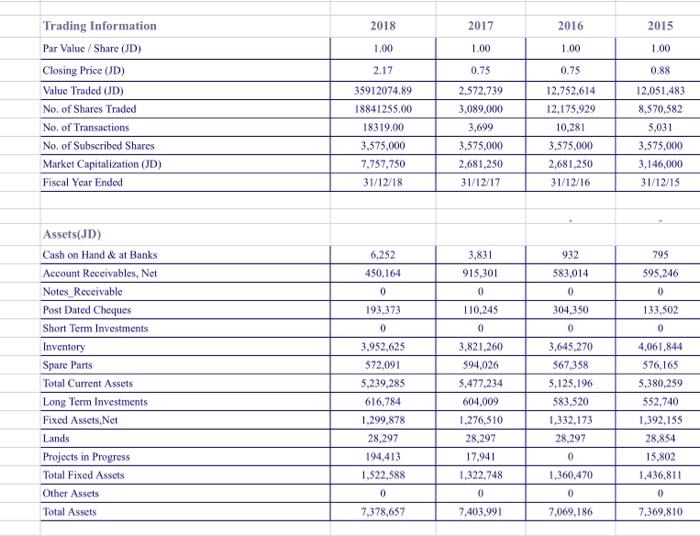
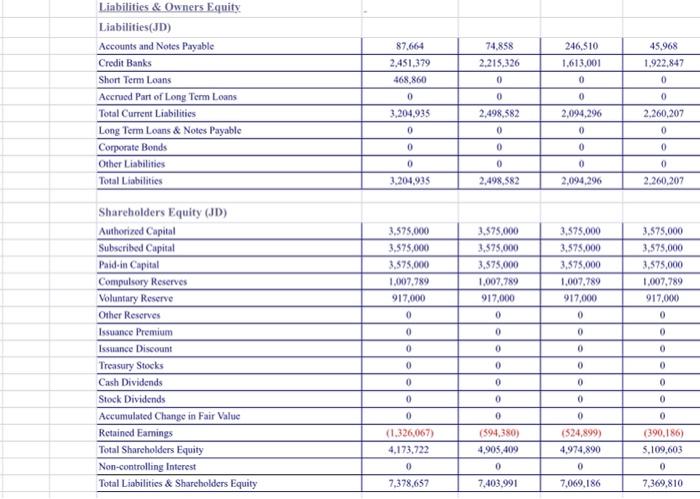
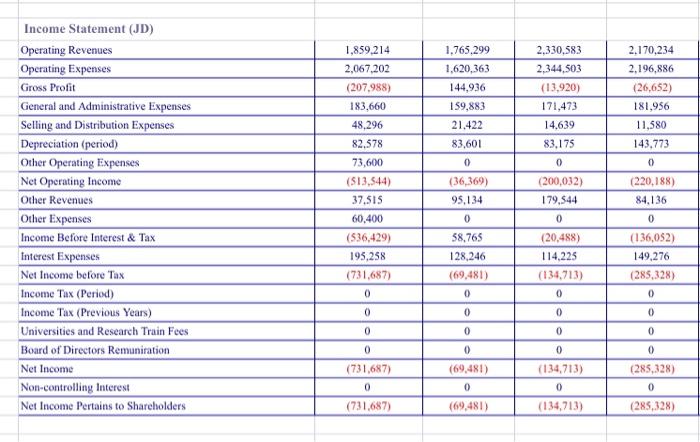
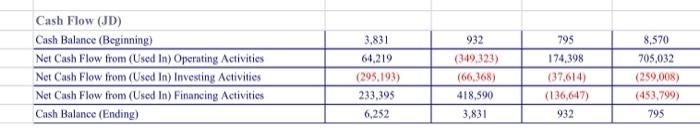
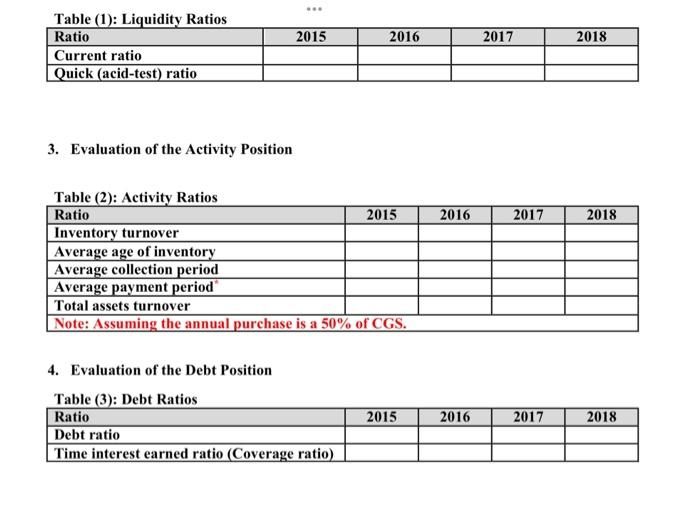
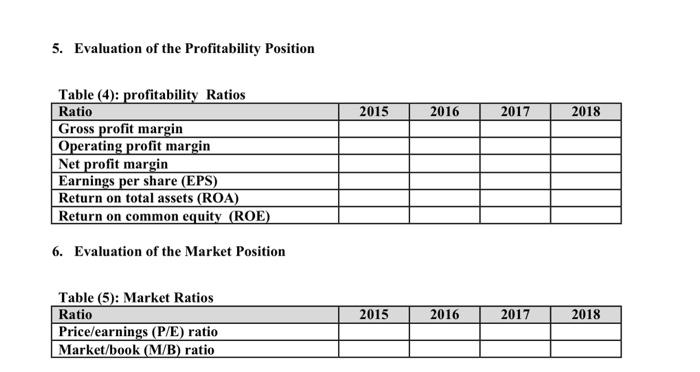
2018 2017 2016 2015 1.00 1.00 1.00 1.00 2.17 0.75 0.75 0.88 12.752.614 Trading Information Par Value / Share (JD) Closing Price (JD) Value Traded (JD) No. of Shares Traded No. of Transactions No. of Subscribed Shares Market Capitalization (JD) Fiscal Year Ended 35912074.89 18841255.00 18319,00 3,575,000 7,757,750 31/12/18 2.572.739 3.089,000 3,699 3,575,000 2,681,250 31/12/17 12,175,929 10,281 3,575,000 2,681,250 31/12/16 12.051.483 8,570,582 5,031 3,575.000 3,146,000 31/12/15 6,252 450,164 3,831 915,301 0 932 583.014 795 595.246 0 0 0 193.373 133,502 110.245 0 0 0 Assets(JD) Cash on Hand & at Banks Account Receivables, Net Notes_Receivable Post Dated Cheques Short Term Investments Inventory Spare Parts Total Current Assets Long Term Investments Fixed Assets.Net Lands Projects in Progress Total Fixed Assets Other Assets Total Assets 3,952,625 572,091 5,239,285 616,784 1.299,878 28,297 194,413 1,522,588 3,821.260 594.026 5,477.234 604,009 1,276,510 28,297 17,941 1,322,748 304,350 0 3,645.270 567,358 5.125.196 583.520 1,332,173 28,297 0 1,360,470 0 4,061,844 576,165 5,380,259 552.740 1.392,155 28,854 15.802 1.436,811 0 0 0 7.403,991 7,378,657 7,069,186 7.369,810 74,858 2,215,326 0 246,510 1.613,001 0 45.968 1.922,847 0 Liabilities & Owners Equity Liabilities(JD) Accounts and Notes Payable Credit Banks Short Term Loans Accrued Part of Long Term Loans Total Current Liabilities Long Term Loans & Notes Payable Corporate Bonds Other Liabilities Total Liabilities 87.664 2,451.379 468.860 0 3.204.935 0 0 0 0 2,094.296 2,498,582 0 2,260,207 0 0 0 0 0 0 0 3.204.935 0 2,498,582 0 2,094,296 0 2.260.207 3.575.000 3.575,000 3.575.000 1.007,789 917.000 0 3.575,000 3,575.000 3.575.000 1,007,789 917,000 3.575.000 3.575,000 3.575.000 1.007.789 917,000 0 3.575.000 3,575,000 3,575,000 1.007,789 917.000 0 0 0 0 0 0 Shareholders Equity (JD) Authorized Capital Subscribed Capital Paid in Capital Compulsory Reserves Voluntary Reserve Other Reserves Issuance Premium Issuance Discount Treasury Stocks Cash Dividends Stock Dividends Accumulated Change in Fair Value Retained Earings Total Shareholders Equity Non-controlling Interest Total Liabilities & Shareholders Equity 0 0 0 0 0 0 0 0 0 0 0 0 0 0 0 0 0 0 0 0 (1.326,067) 4.173.722 (594,380) 4,905,409 (524,899) 4,974.890 (390,186) 5,109,603 0 7,369,810 0 0 0 7,378,657 7.403,991 7,069,186 2,330,583 2,344,503 (13,920) 171,473 14.639 83.175 1,765,299 1.620,363 144,936 159,883 21.422 83,601 0 (36,369) 95,134 0 2.170,234 2,196,886 (26,652) 181,956 11,580 143.773 0 0 1,859,214 2,067.202 (207.988) 183,660 48,296 82.578 73,600 ($13,544) 37.SIS 60,400 (536,429) 195,258 (731,687) 0 Income Statement (JD) Operating Revenues Operating Expenses Gross Profit General and Administrative Expenses Selling and Distribution Expenses Depreciation (period) Other Operating Expenses Net Operating Income Other Revenues Other Expenses Income Before Interest & Tax Interest Expenses Net Income before Tax Income Tax (Period) Income Tax (Previous Years) Universities and Research Train Fees Board of Directors Remunication Net Income Non-controlling Interest Net Income Pertains to Shareholders (200,032) 179.544 (220,188) 84.136 0 58,765 128,246 (69.481) (20,488) 114,225 (134,713) 0 0 (136,052) 149,276 (285,328) 0 0 0 0 0 0 0 0 0 0 0 0 0 0 (285,328) (731,687) 0 (731.687) (69,481) 0 (69.481) (134,713) 0 (134,713) 0 (285,328) 795 Cash Flow (JD) Cash Balance (Beginning) Net Cash Flow from (Used In) Operating Activities Net Cash Flow from (Used In) Investing Activities Net Cash Flow from (Used In) Financing Activities Cash Balance (Ending) 3,831 64.219 (295.193) 233,395 6,252 932 (349,323) (66,368) 418,590 3,831 174,398 (37.614) (136,647) 932 8,570 705,032 (259,008) (453.799) 795 2015 2016 2017 2018 Table (1): Liquidity Ratios Ratio Current ratio Quick (acid-test) ratio 3. Evaluation of the Activity Position 2016 2017 2018 Table (2): Activity Ratios Ratio 2015 Inventory turnover Average age of inventory Average collection period Average payment period Total assets turnover Note: Assuming the annual purchase is a 50% of CGS. 4. Evaluation of the Debt Position Table (3): Debt Ratios Ratio Debt ratio Time interest earned ratio (Coverage ratio) 2015 2016 2017 2018 5. Evaluation of the Profitability Position 2015 2016 2017 2018 Table (4): profitability Ratios Ratio Gross profit margin Operating profit margin Net profit margin Earnings per share (EPS) Return on total assets (ROA) Return on common equity (ROE) 6. Evaluation of the Market Position 2015 2016 2017 2018 Table (5): Market Ratios Ratio Price/earnings (P/E) ratio Market/book (M/B) ratio
Step by Step Solution
There are 3 Steps involved in it

Get step-by-step solutions from verified subject matter experts